A running dashboard in Obsidian from Garmin
run_km run_mi run_minWeekly distance, sessions per week, the longest run, a monthly goal and what your recovery says, all from the distance and minutes Garmy writes into your daily notes. Pick Run in the wizard and Garmy writes the blocks. This page explains each one so you can change it.
1Distance and minutes, one number per day
Garmy sums every run of a day into run_km and run_min. Trail, treadmill, track and virtual runs count as runs. A day without a run has no property.
---
run_km: 8.2
run_min: 45
---
Example values. In miles mode the distance is run_mi instead (step 5).
2This week and this month
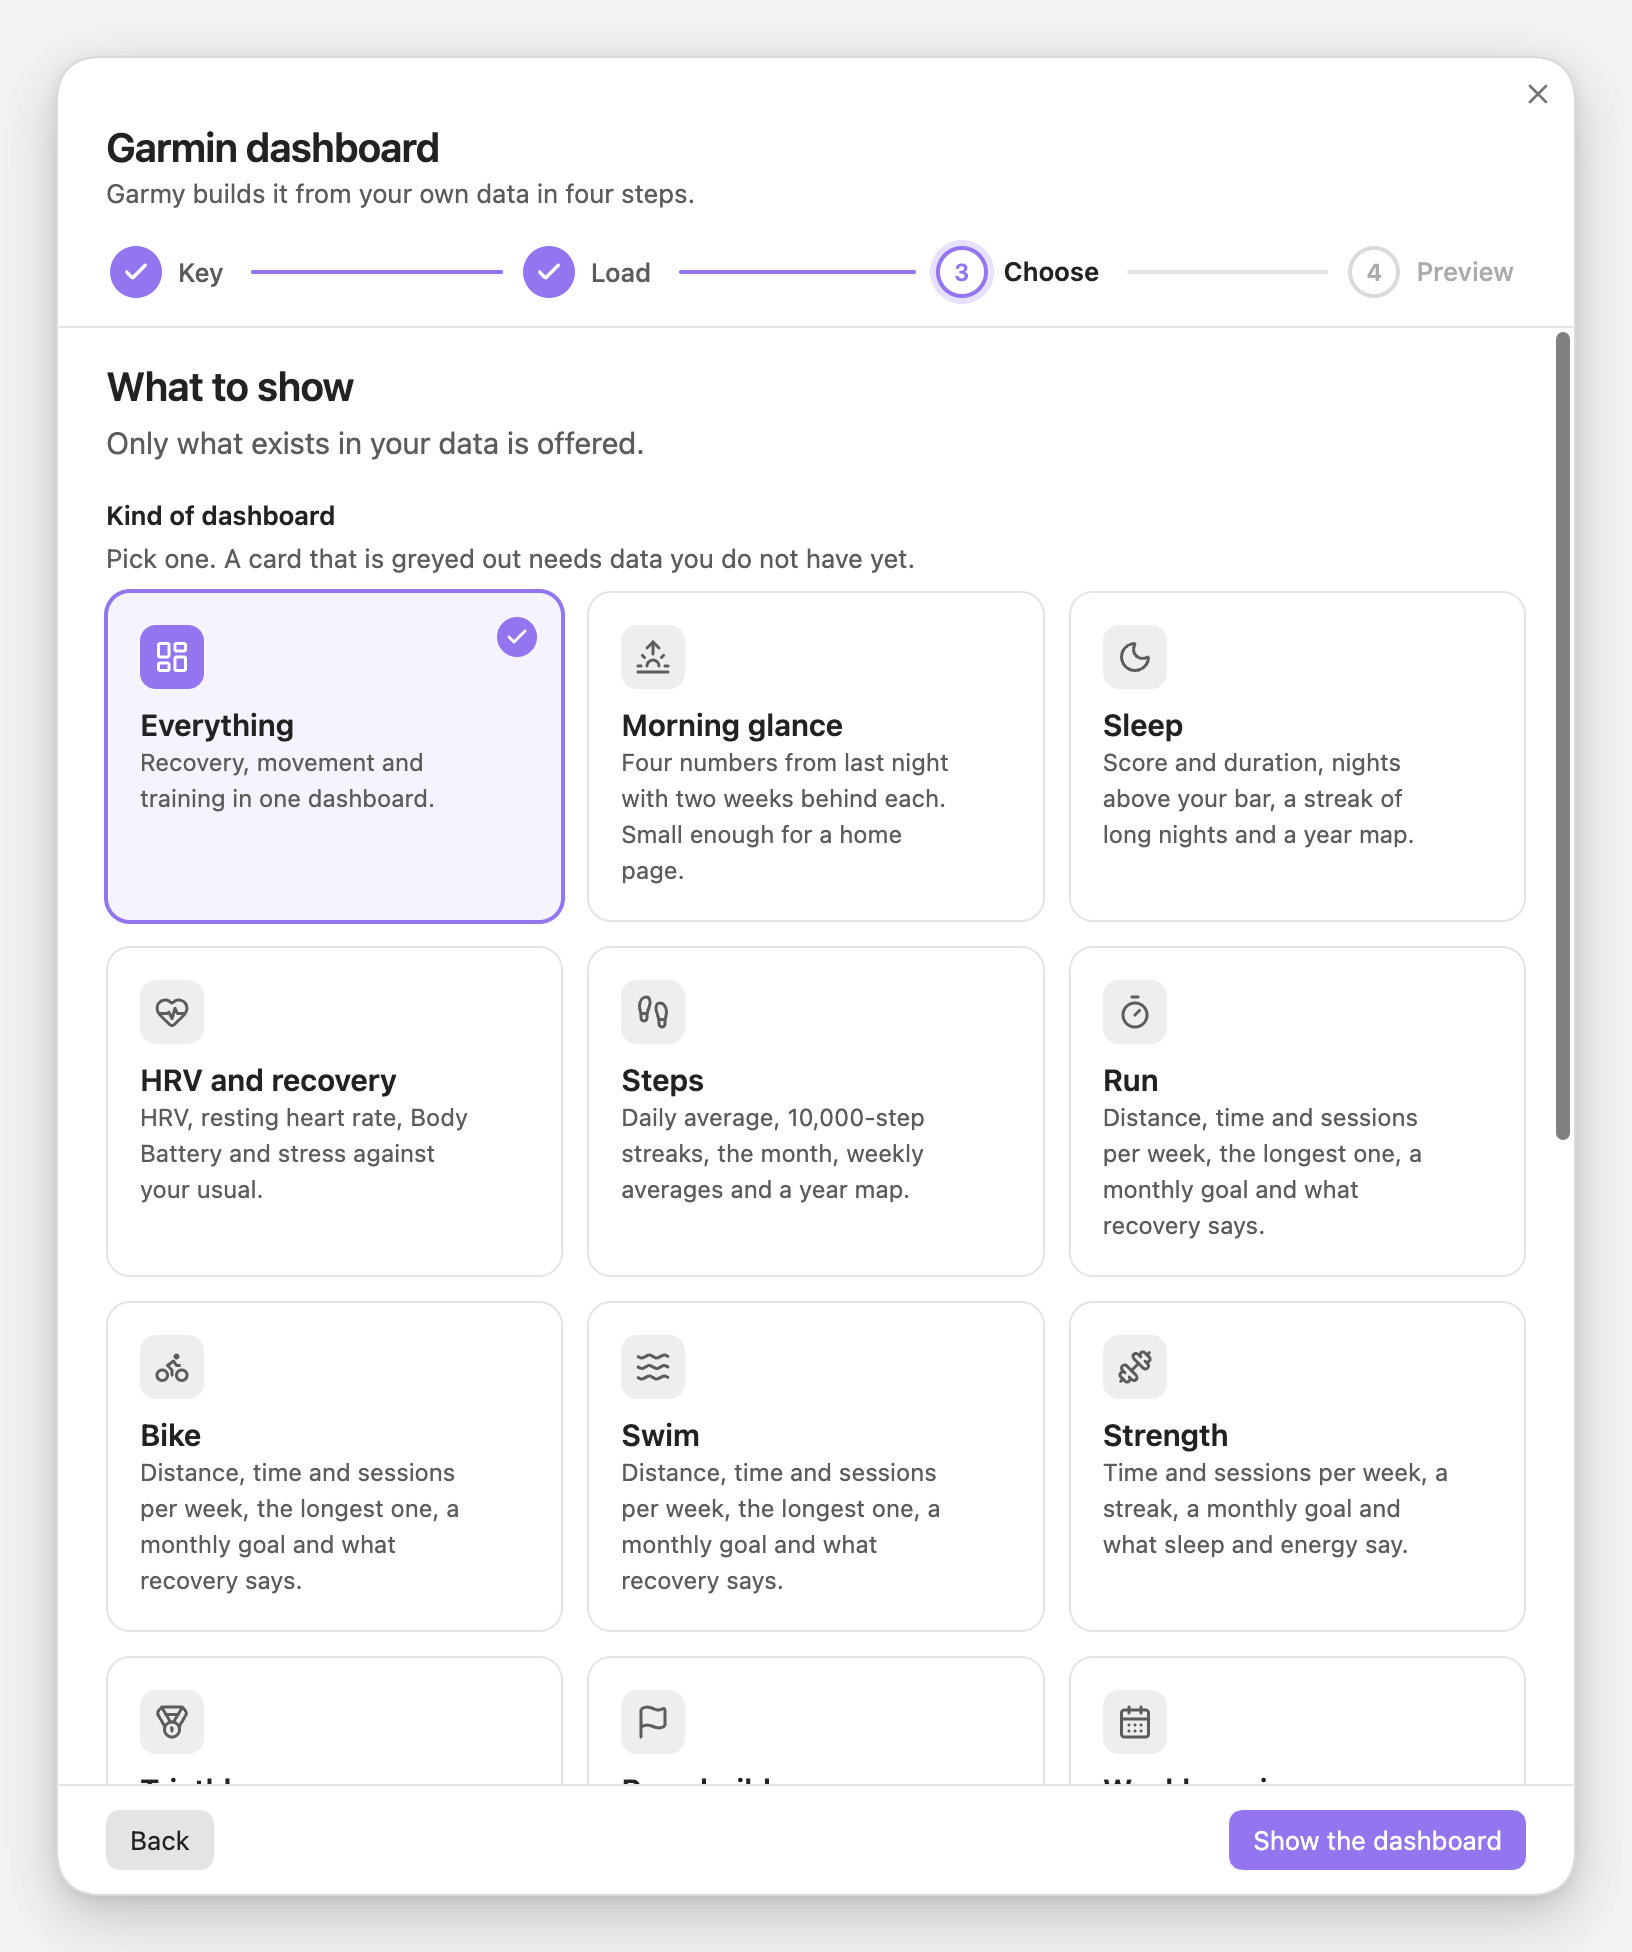
Run Garmy: Build a Garmin dashboard and pick Run in the third step. The first block is four cards for the last 7 days, each compared with the 7 days before once you have 14 days of data.
```stats
columns: 4
source: Garmy/data
items:
  - { label: Distance, field: run_km, agg: sum, period: 7d, precision: 1, unit: " km", icon: 🏃, sub: 7 days, compare: true, better: up }
  - { label: Time, field: run_min, agg: sum, period: 7d, unit: " min", icon: ⏱, sub: 7 days, compare: true, better: up }
  - { label: Sessions, agg: count, where: "run_min > 0", period: 7d, icon: 📅, sub: 7 days, compare: true, better: up }
  - { label: Longest, field: run_km, agg: max, period: 90d, precision: 1, unit: " km", icon: 🏆, sub: 90 d }
```
agg: countSessions: the days with minutes.where: "run_min > 0"keeps only those days, so a rest day is not a session.agg: maxThe longest run in the last 90 days, from the distance field.compare: trueShows the change against the same stretch of the previous period, to date.
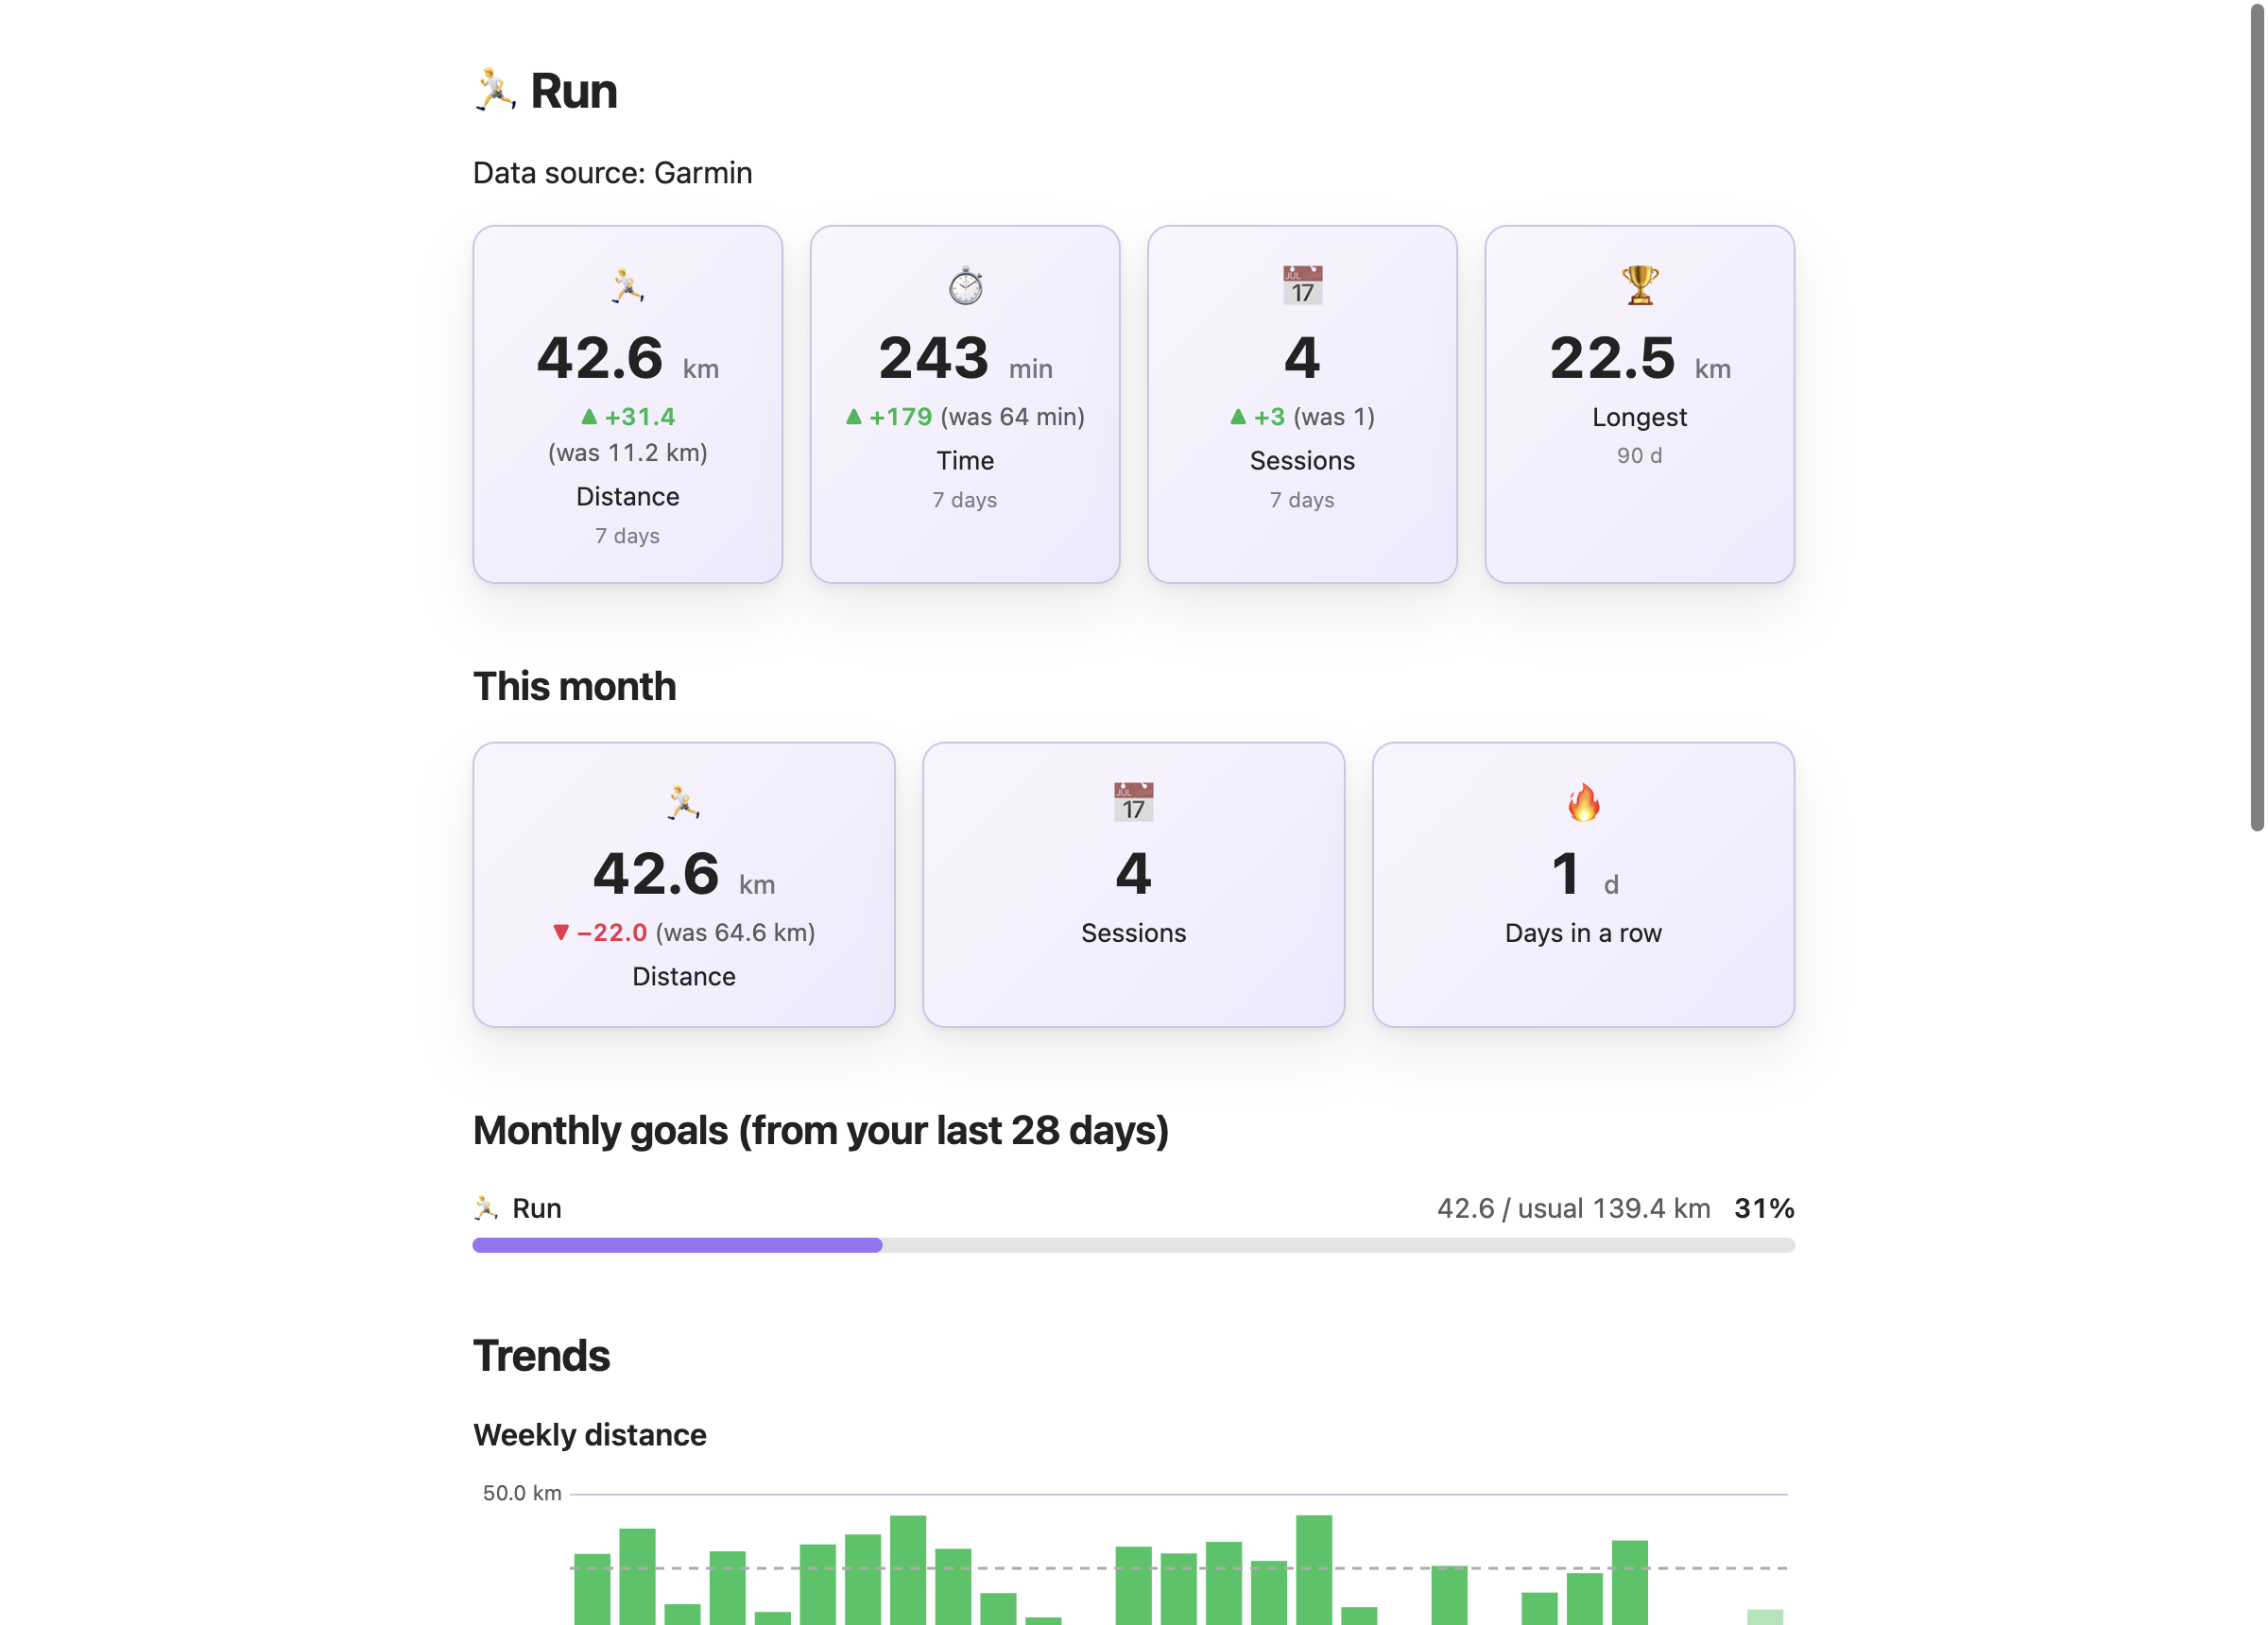
Under it comes a second row for the calendar month: distance, sessions and the days you have run in a row.
```stats
columns: 3
source: Garmy/data
items:
  - { label: Distance, field: run_km, agg: sum, period: month, precision: 1, unit: " km", icon: 🏃, compare: true, better: up }
  - { label: Sessions, agg: count, where: "run_min > 0", period: month, icon: 📅 }
  - { label: Days in a row, field: run_min, agg: current_streak, at_least: 1, unit: " d", icon: 🔥 }
```3Weekly distance and sessions
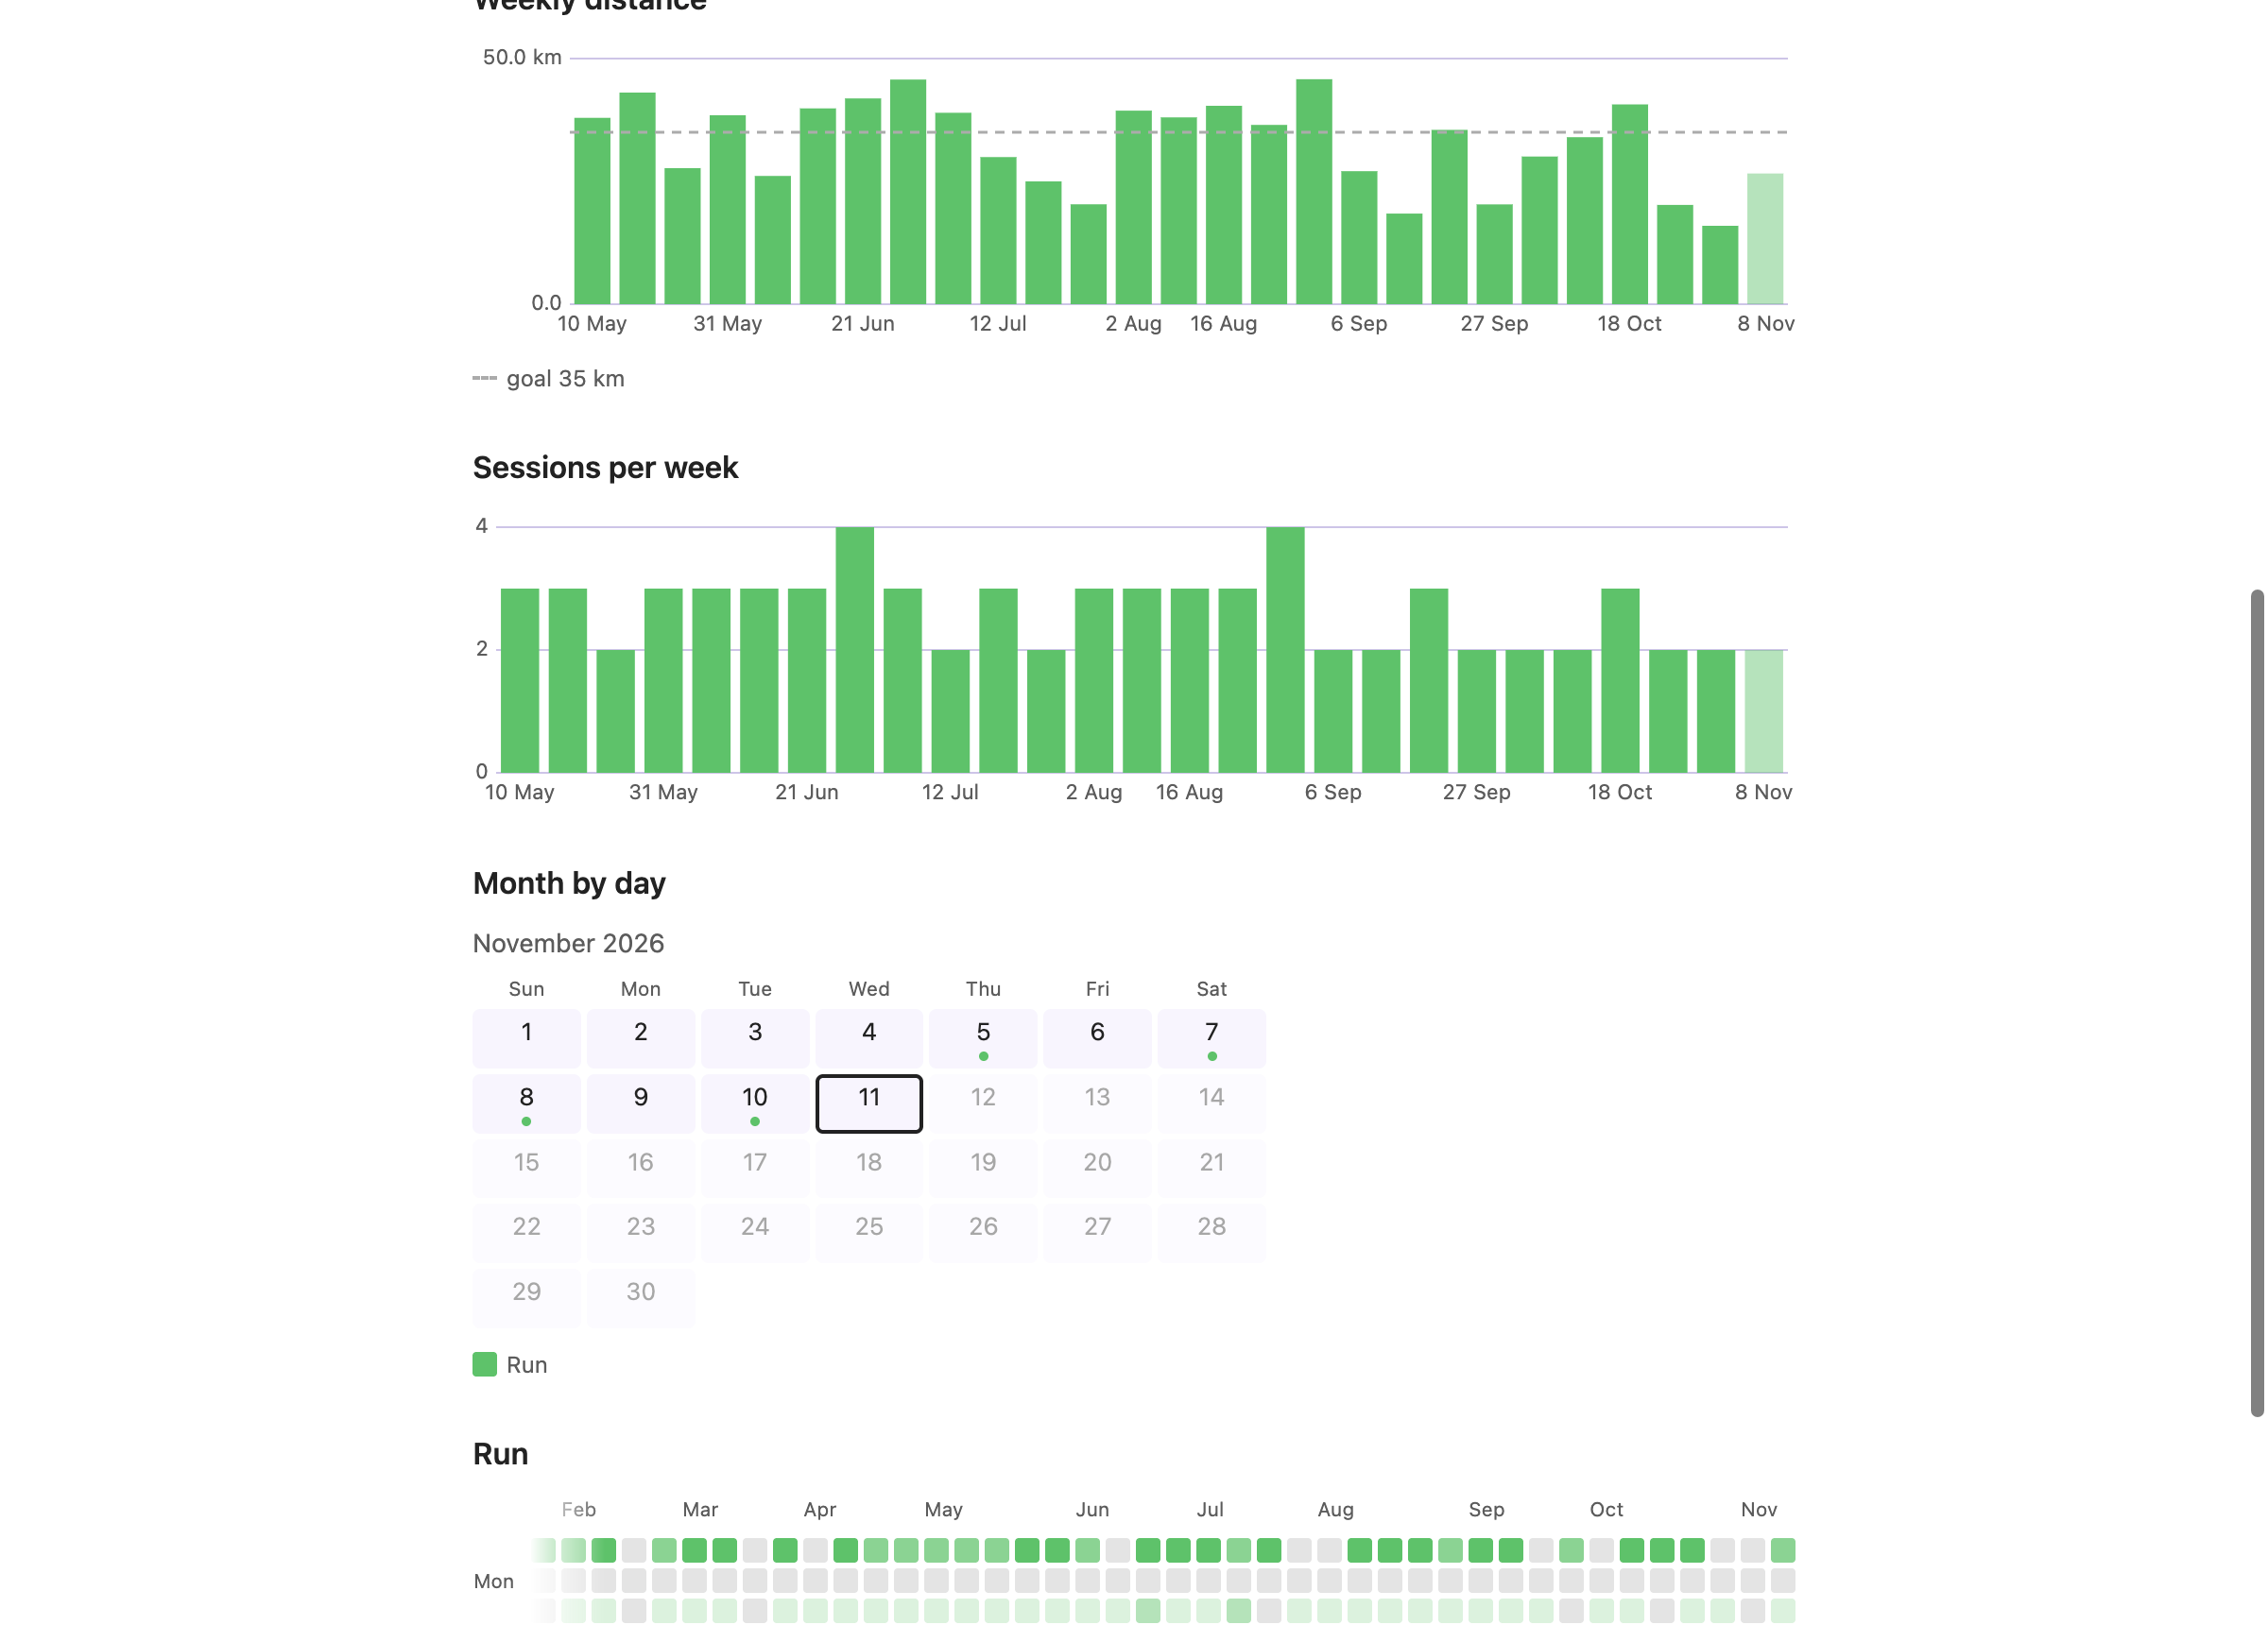
With 28 days of data the charts group by week. The distance bars carry a dashed goal line taken from your own last four weeks, plus a tenth.
```dashy-chart
source: Garmy/data
field: run_km
type: bar
bucket: week
range: 119d
agg: sum
color: green
label: Weekly distance
unit: km
precision: 1
goal: 20
title: Weekly distance
```
Sessions per week is a chart that counts days instead of adding numbers:
```dashy-chart
source: Garmy/data
where: "run_min > 0"
type: bar
bucket: week
range: 119d
agg: count
color: green
label: Sessions
title: Sessions per week
```
agg: countNeeds nofield: it counts the days left afterwhere.bucket: weekOne bar per week. The last bar is still running and is drawn lighter.
4A monthly goal and what recovery says
The goal is your last 28 days plus a tenth, rounded up to a number a person would pick: 110 km becomes 120, not 200.
```progress
source: Garmy/data
period: month
items:
  - { label: Run, field: run_km, agg: sum, goal: 80, unit: " km", icon: 🏃 }
```
The page ends with HRV and resting heart rate over the same stretch, because a hard week usually shows there first.
```dashy-chart
source: Garmy/data
range: 90d
agg: avg
title: HRV / Resting HR
series:
  - { field: hrv, label: HRV, color: green }
  - { field: resting_hr, label: Resting HR, color: red }
```5Miles instead of kilometers
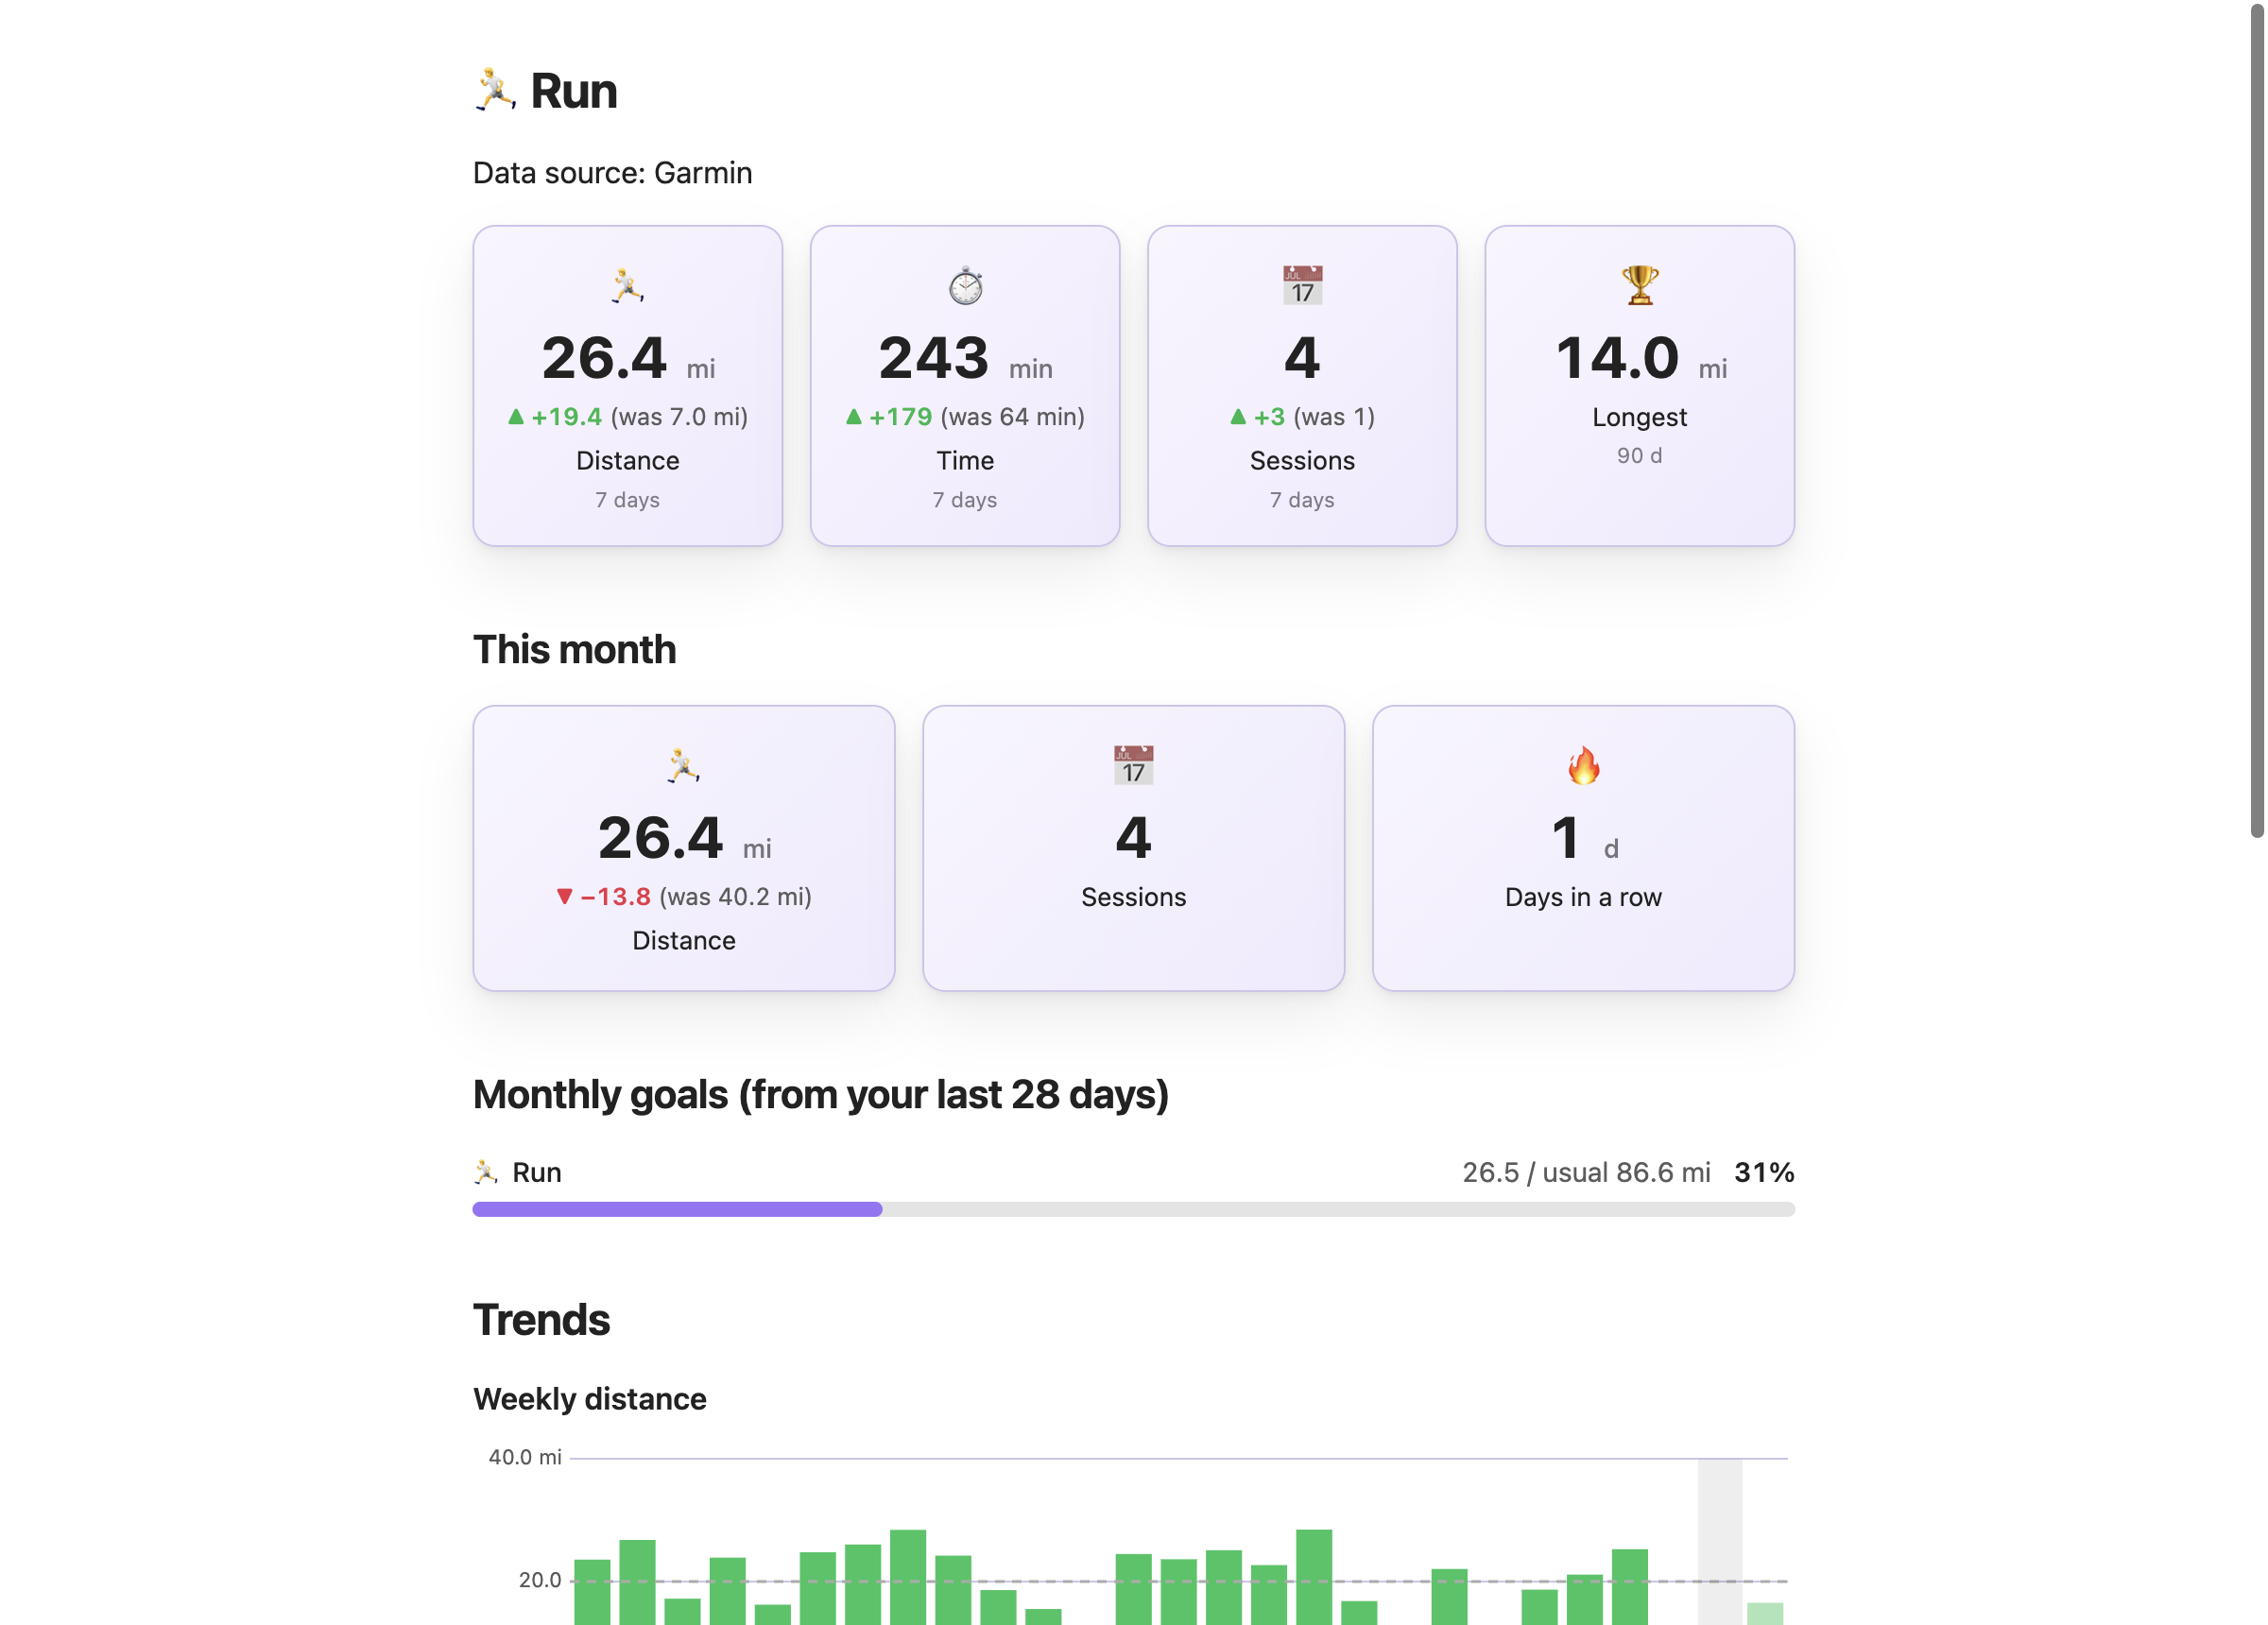
Open Garmy in settings and set Distance units to miles, or switch it in the wizard under Options. Garmy fills run_mi, bike_mi and swim_yd into the notes you already have, with no request to Garmin, and keeps the kilometer properties, so you can switch back. Rebuild the dashboard and the same page is drawn in miles.
```stats
columns: 4
source: Garmy/data
items:
  - { label: Distance, field: run_mi, agg: sum, period: 7d, precision: 1, unit: " mi", icon: 🏃, sub: 7 days, compare: true, better: up }
  - { label: Time, field: run_min, agg: sum, period: 7d, unit: " min", icon: ⏱, sub: 7 days, compare: true, better: up }
  - { label: Sessions, agg: count, where: "run_min > 0", period: 7d, icon: 📅, sub: 7 days, compare: true, better: up }
  - { label: Longest, field: run_mi, agg: max, period: 90d, precision: 1, unit: " mi", icon: 🏆, sub: 90 d }
```
A fresh install on an en-US machine starts in miles. An update keeps kilometers.
Related guides
Sleep, HRV, steps, one page per sport, triathlon, race build, weekly and monthly reviews: what each shows and what it needs.
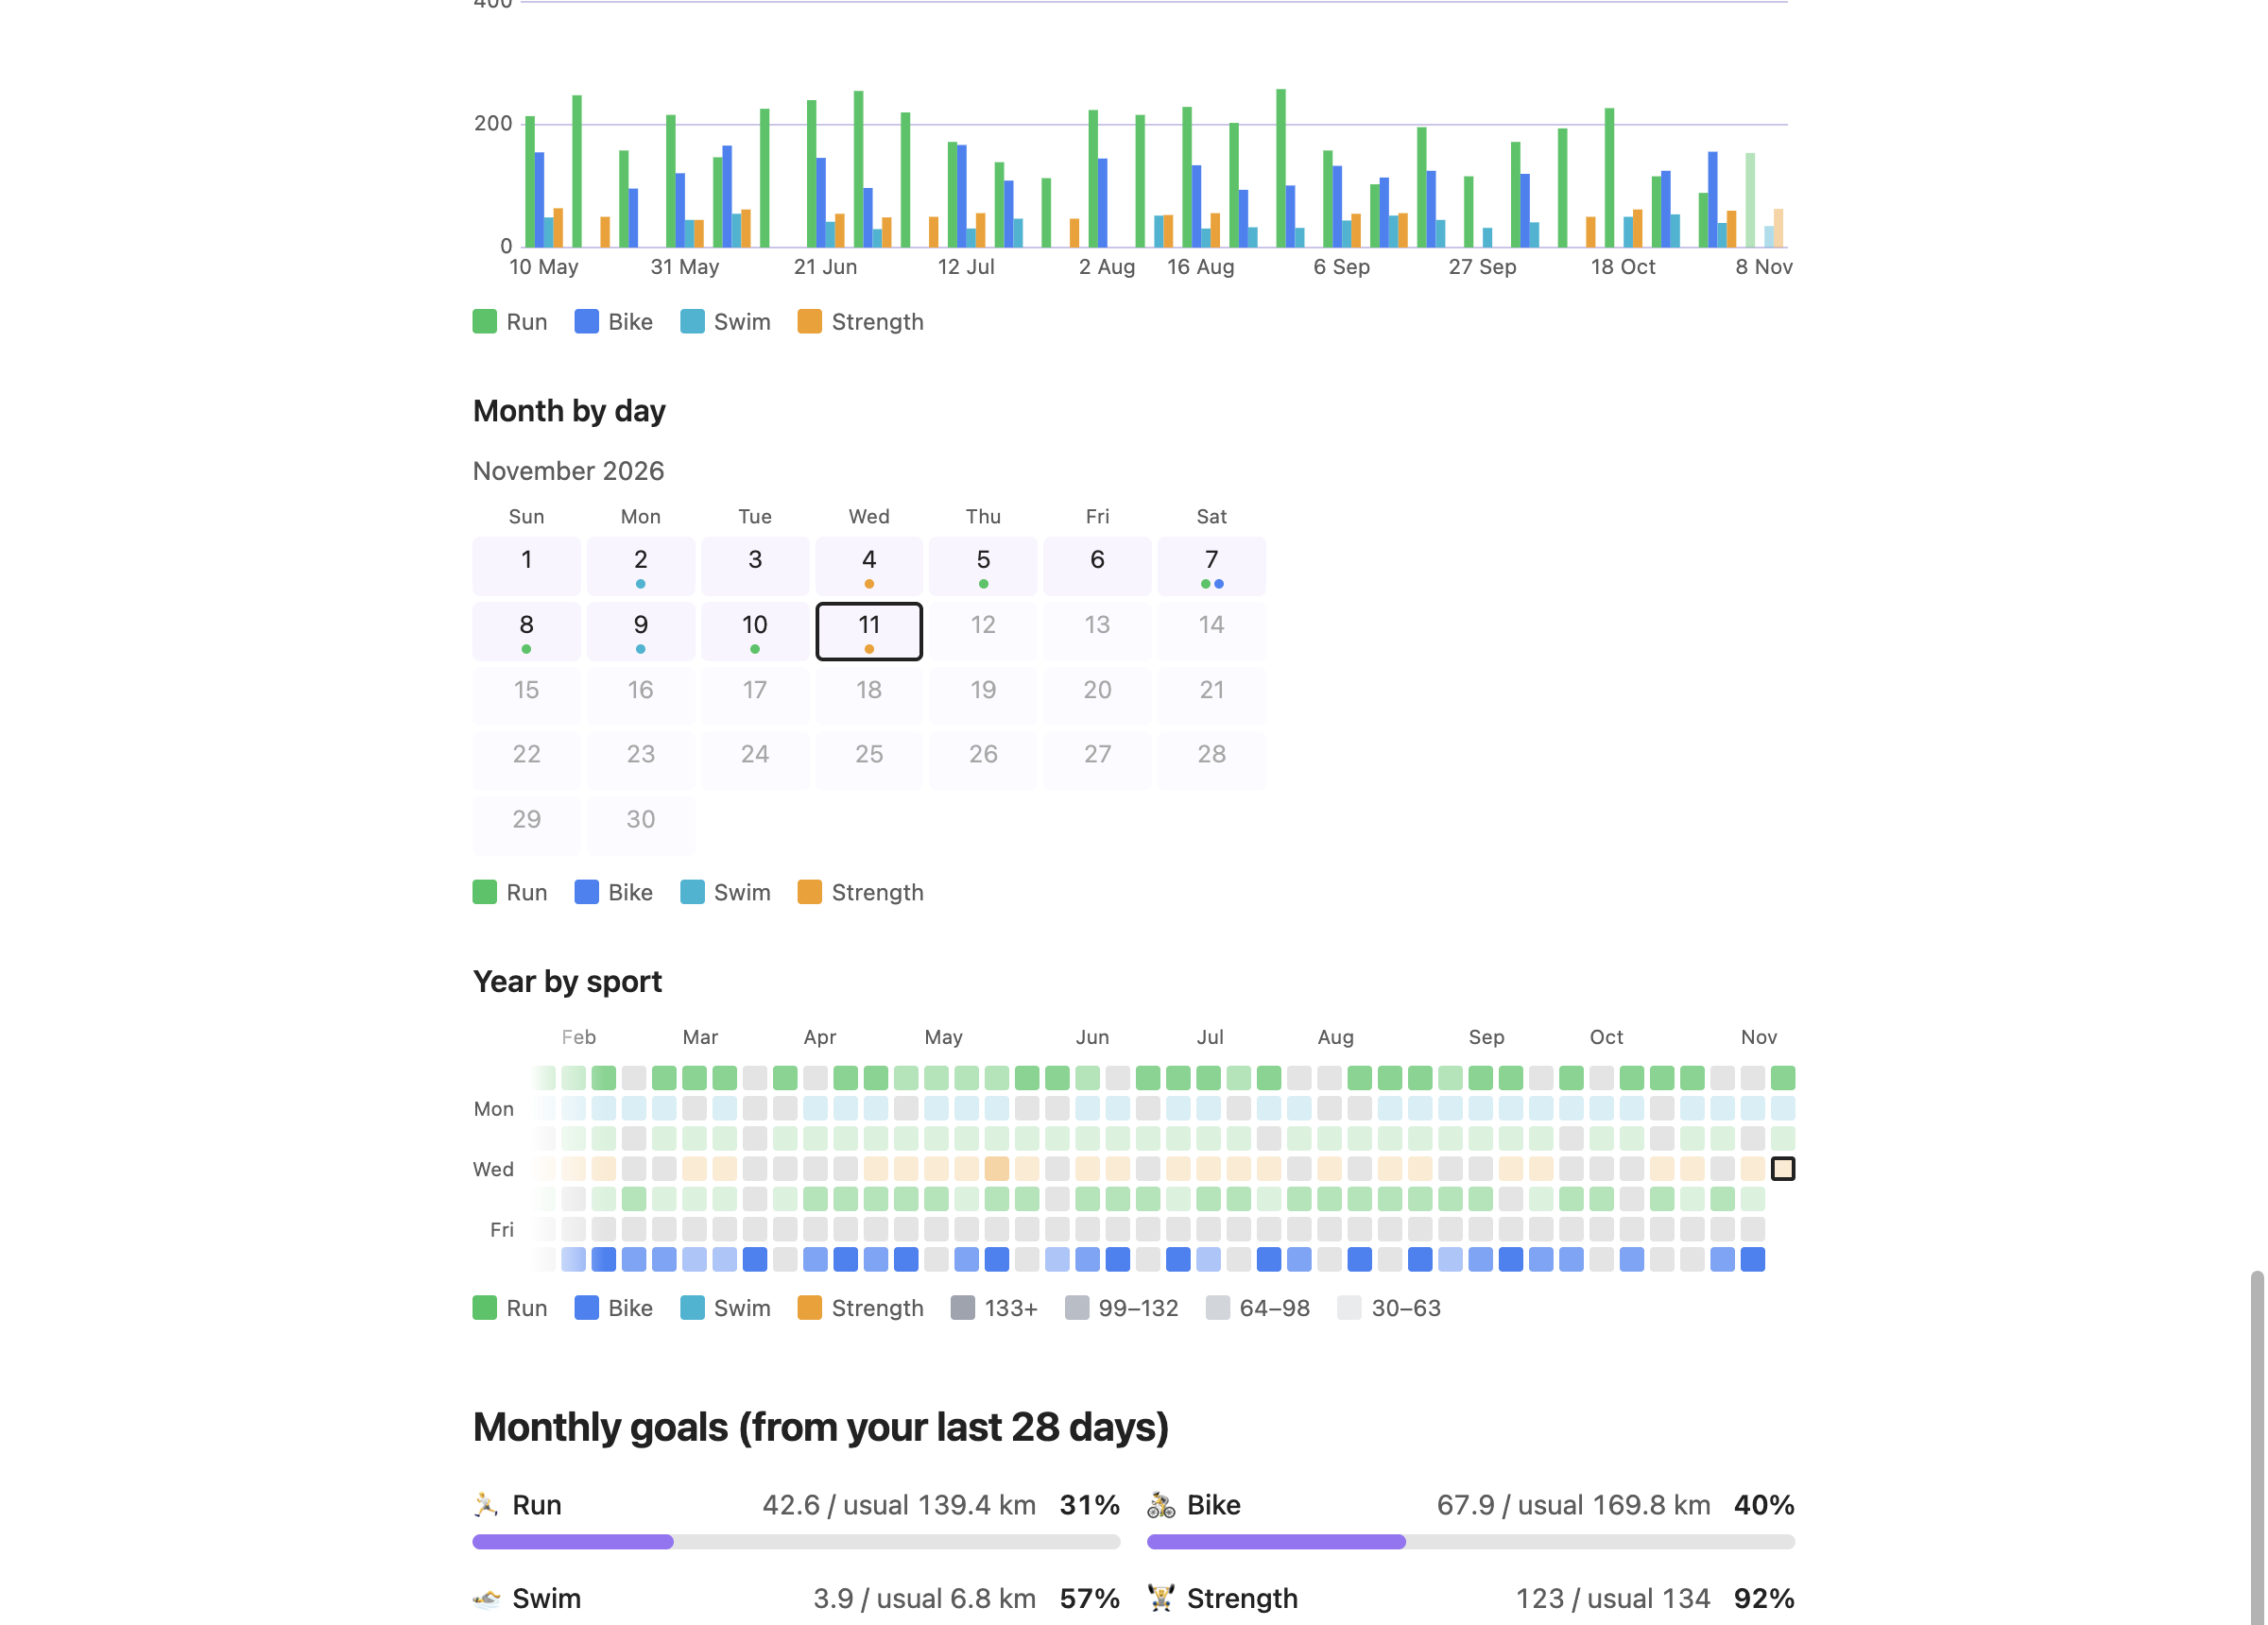
Run, bike, swim and strength per week, a month calendar, a year map by sport and monthly goals.
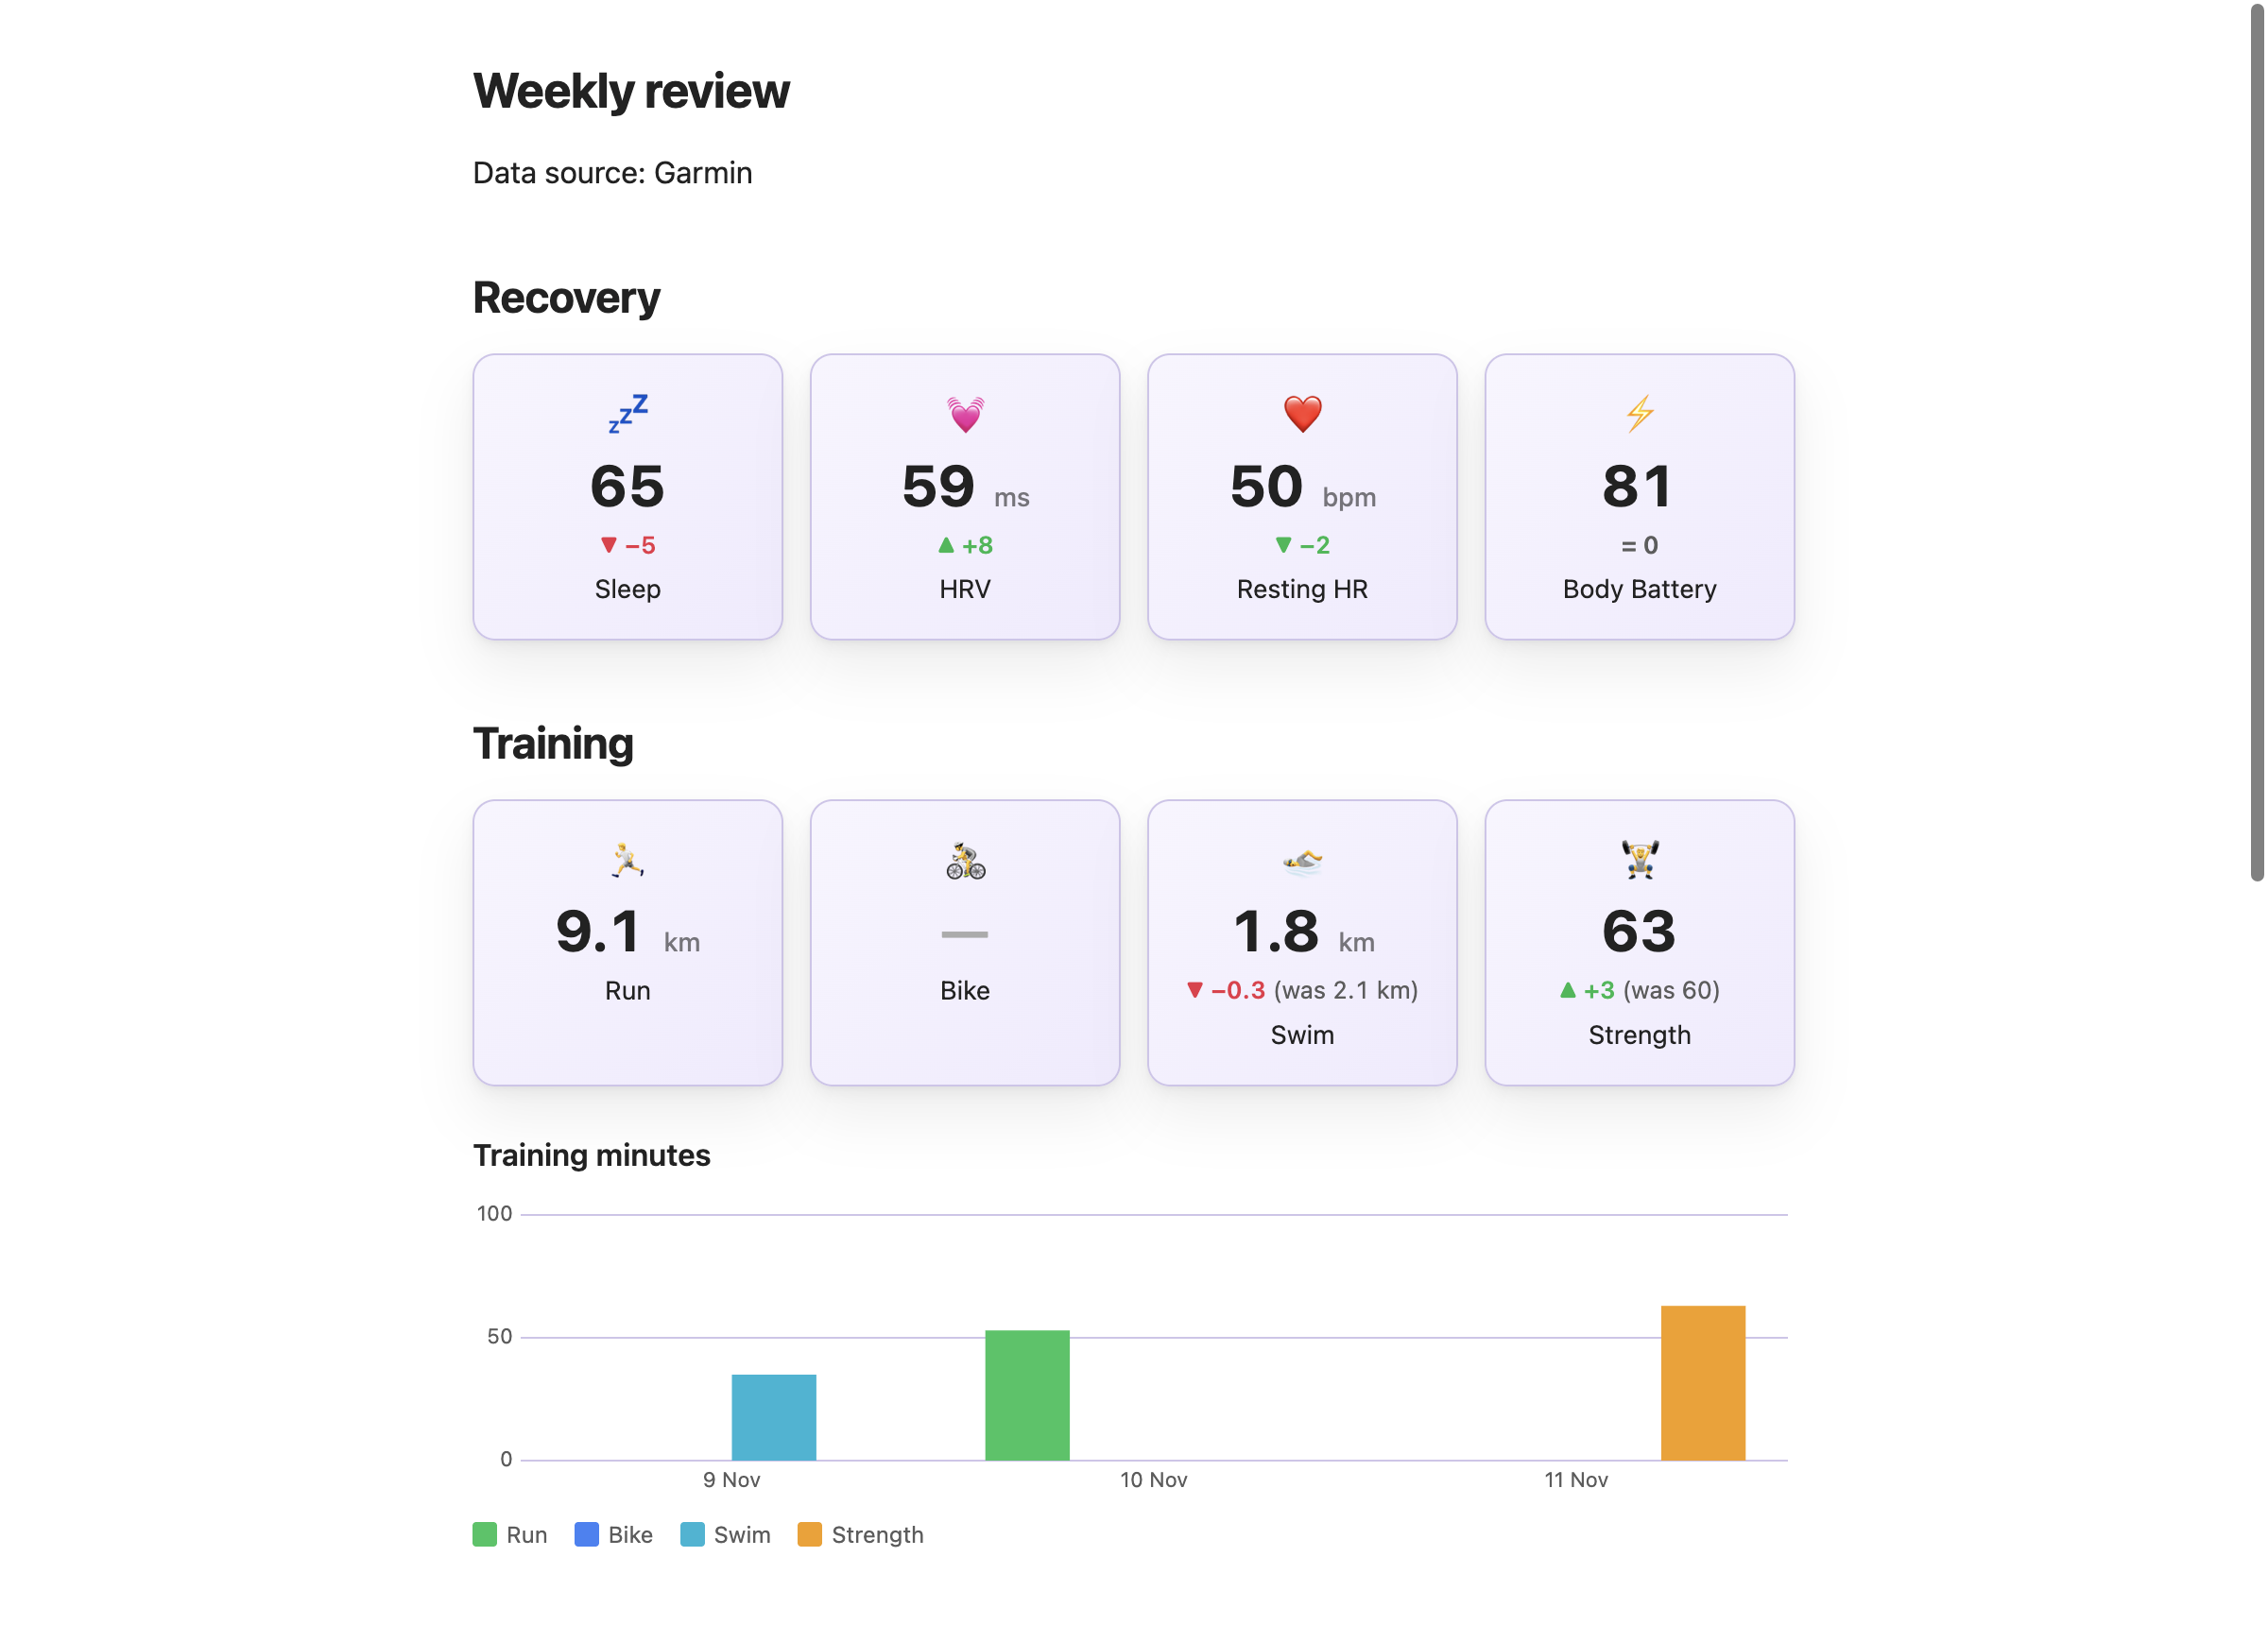
A note named for its week counts that week against your usual, whenever you open it.
Install Garmy and Dashy, load your history and pick Run in the third step.