A triathlon training log in Obsidian from Garmin
run_km run_min bike_km bike_min swim_km swim_min strength_minRun, bike, swim and strength per week, a month calendar, a year map by sport and monthly goals, from the activities on your Garmin watch. Garmy loads the activities and writes the blocks. This page shows what they are and what each key does.

What Garmy reads from your watch
Garmy reads your Garmin activities and sums them per local day into seven properties. Several workouts on one day add up, even when Garmin returns them on different pages.
| Sport | Garmin activity types | Properties |
|---|---|---|
| Run | running trail_running treadmill_running track_running virtual_run street_running | run_km run_min |
| Bike | cycling road_biking indoor_cycling mountain_biking gravel_cycling virtual_ride e_bike_fitness | bike_km bike_min |
| Swim | lap_swimming open_water_swimming | swim_km swim_min |
| Strength | strength_training | strength_min |
A triathlon recorded as one multi-sport activity is not divided into swim, bike and run, so it adds nothing to those three sports. Other activity types, such as hiking or yoga, are not counted either. Record the legs as separate activities if you want them in the log.
1Build the training part
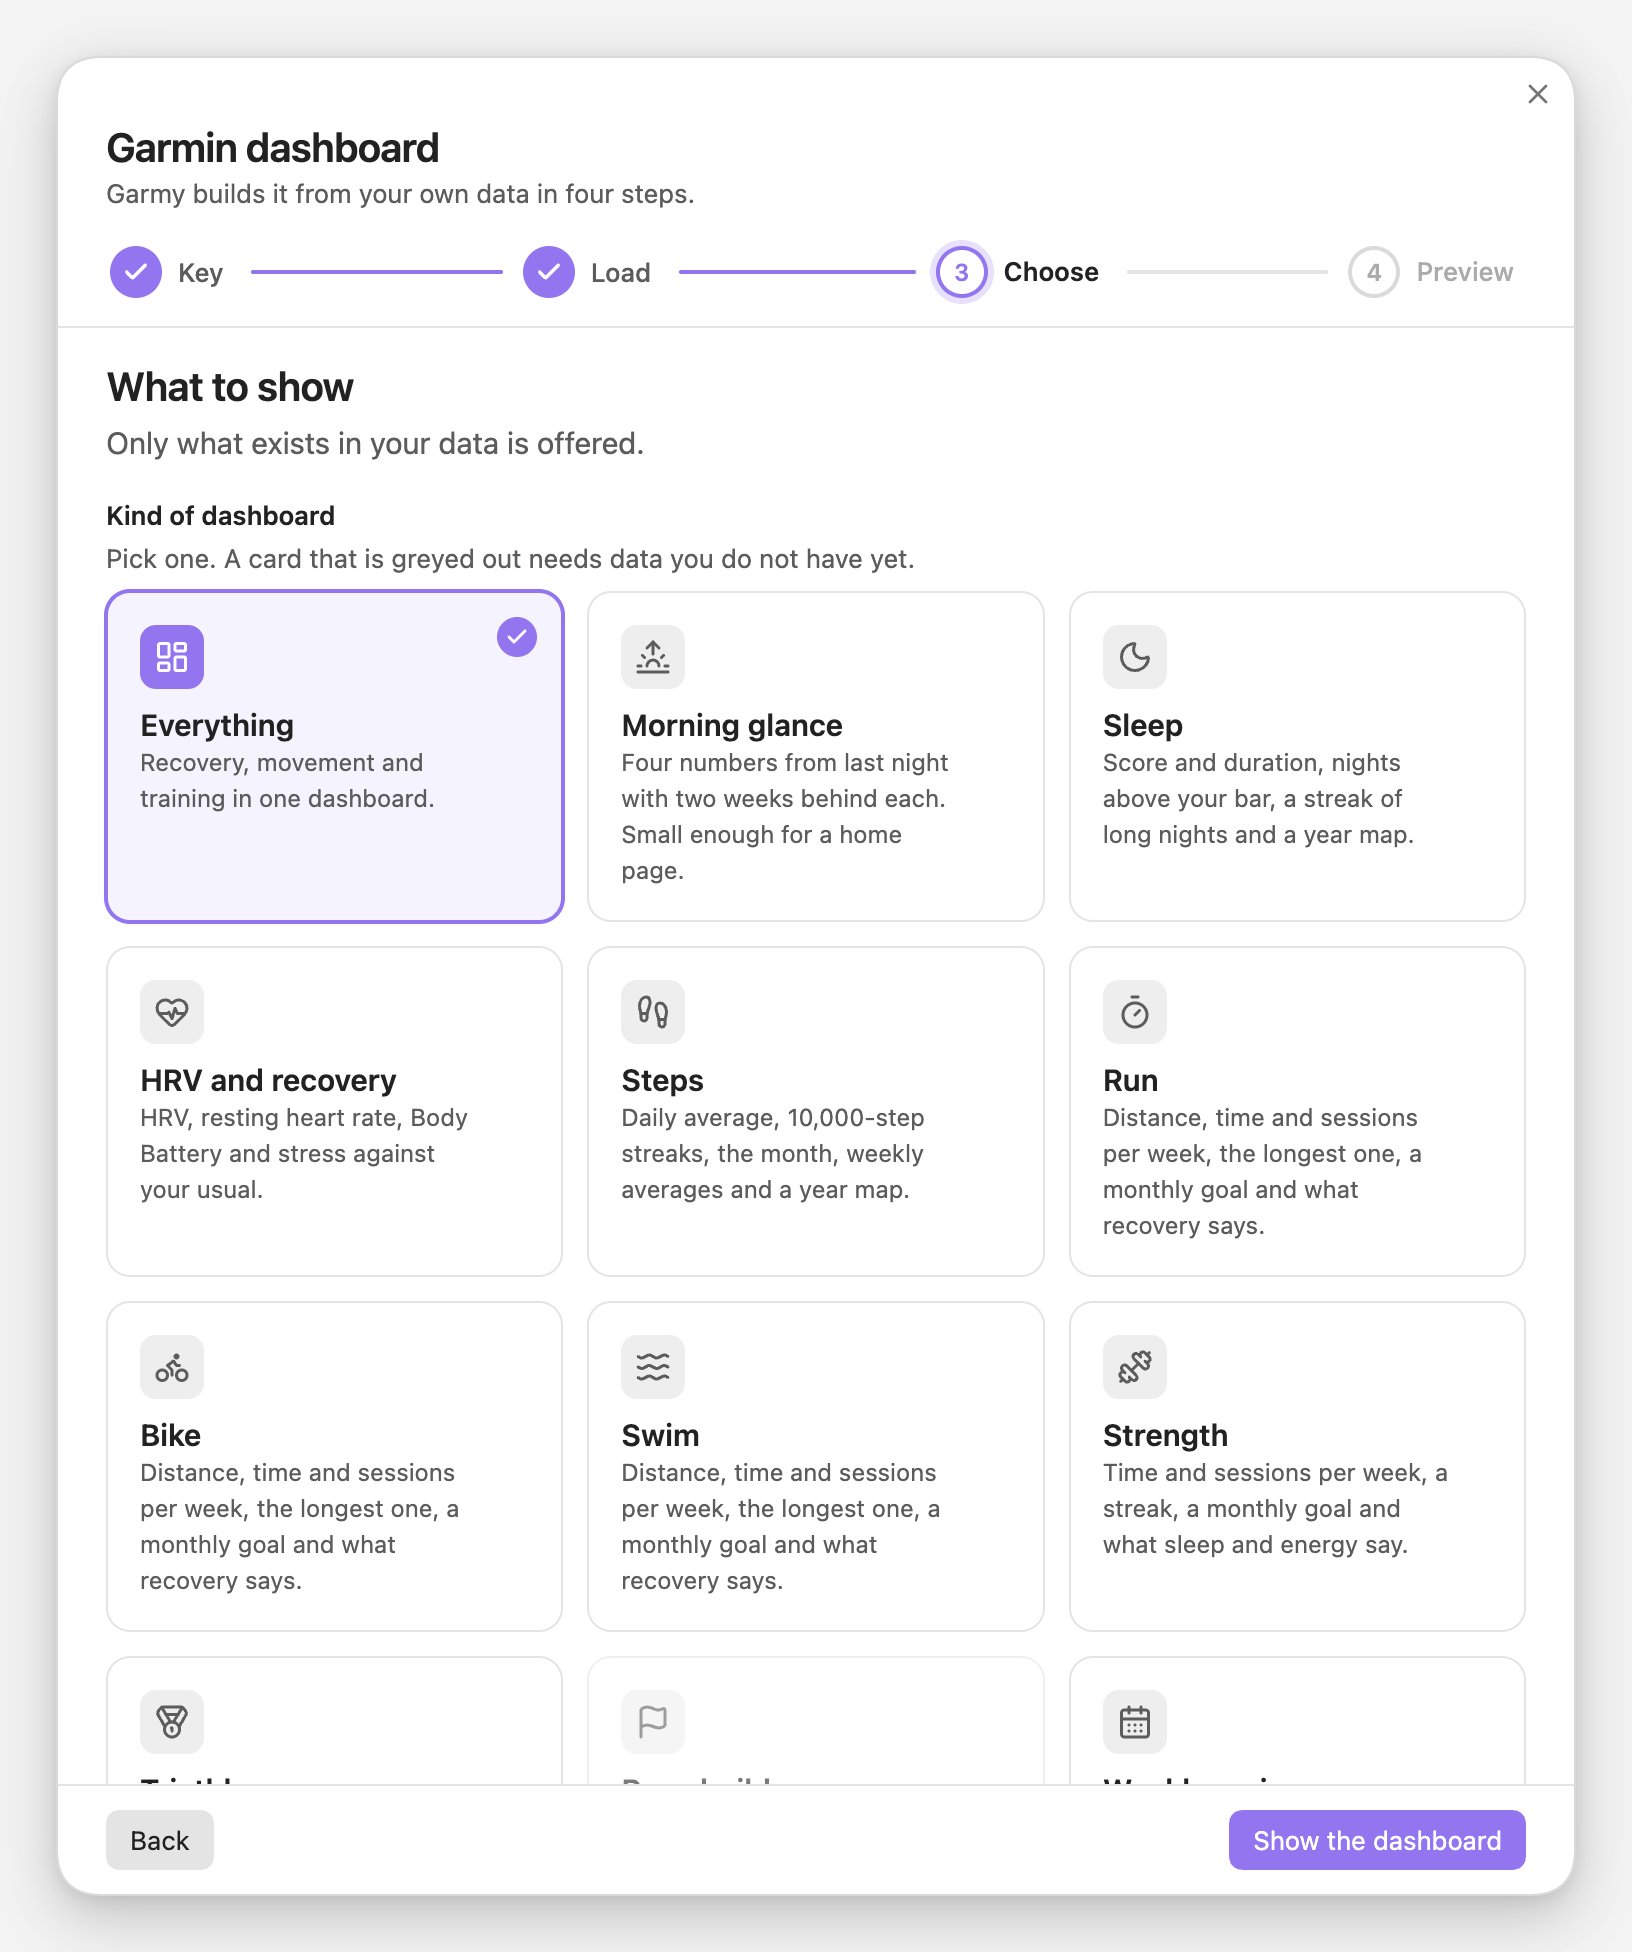
Run Garmy: Build a Garmin dashboard, load the period you want and on Choose keep Training. The Sports chips list only the sports found in your data, so a swim chip appears once a swim is in the history. Untick a sport to leave it out.
2Cards for the last 7 days
```stats
columns: 4
source: Garmy/data
period: 7d
items:
  - { label: Run, field: run_km, agg: sum, precision: 1, unit: " km", icon: 🏃, compare: true, better: up }
  - { label: Bike, field: bike_km, agg: sum, precision: 0, unit: " km", icon: 🚴, compare: true, better: up }
  - { label: Swim, field: swim_km, agg: sum, precision: 1, unit: " km", icon: 🏊, compare: true, better: up }
  - { label: Strength, field: strength_min, agg: sum, precision: 0, icon: 🏋️, compare: true, better: up }
```
period: 7dThe last 7 days.agg: sumKilometres for run, bike and swim, minutes for strength.compare: trueShows the change against the period before. Written once you have 14 days of data.precisionDecimals: one for run and swim, none for bike and strength.
3Weekly bars
Minutes per sport, a bar group per week. With 28 days of data or more the bars are weekly. With less, Garmy draws daily bars.
```dashy-chart
source: Garmy/data
type: bar
bucket: week
range: 119d
agg: sum
title: Training minutes
series:
  - { field: run_min, label: Run, color: green }
  - { field: bike_min, label: Bike, color: blue }
  - { field: swim_min, label: Swim, color: cyan }
  - { field: strength_min, label: Strength, color: orange }
```
bucket: weekOne group of bars per week.range: 119dYour history rounded down to whole weeks, at least 28 days and at most 182.seriesOne bar per sport, coloured green, blue, cyan and orange.
4Month calendar and year map
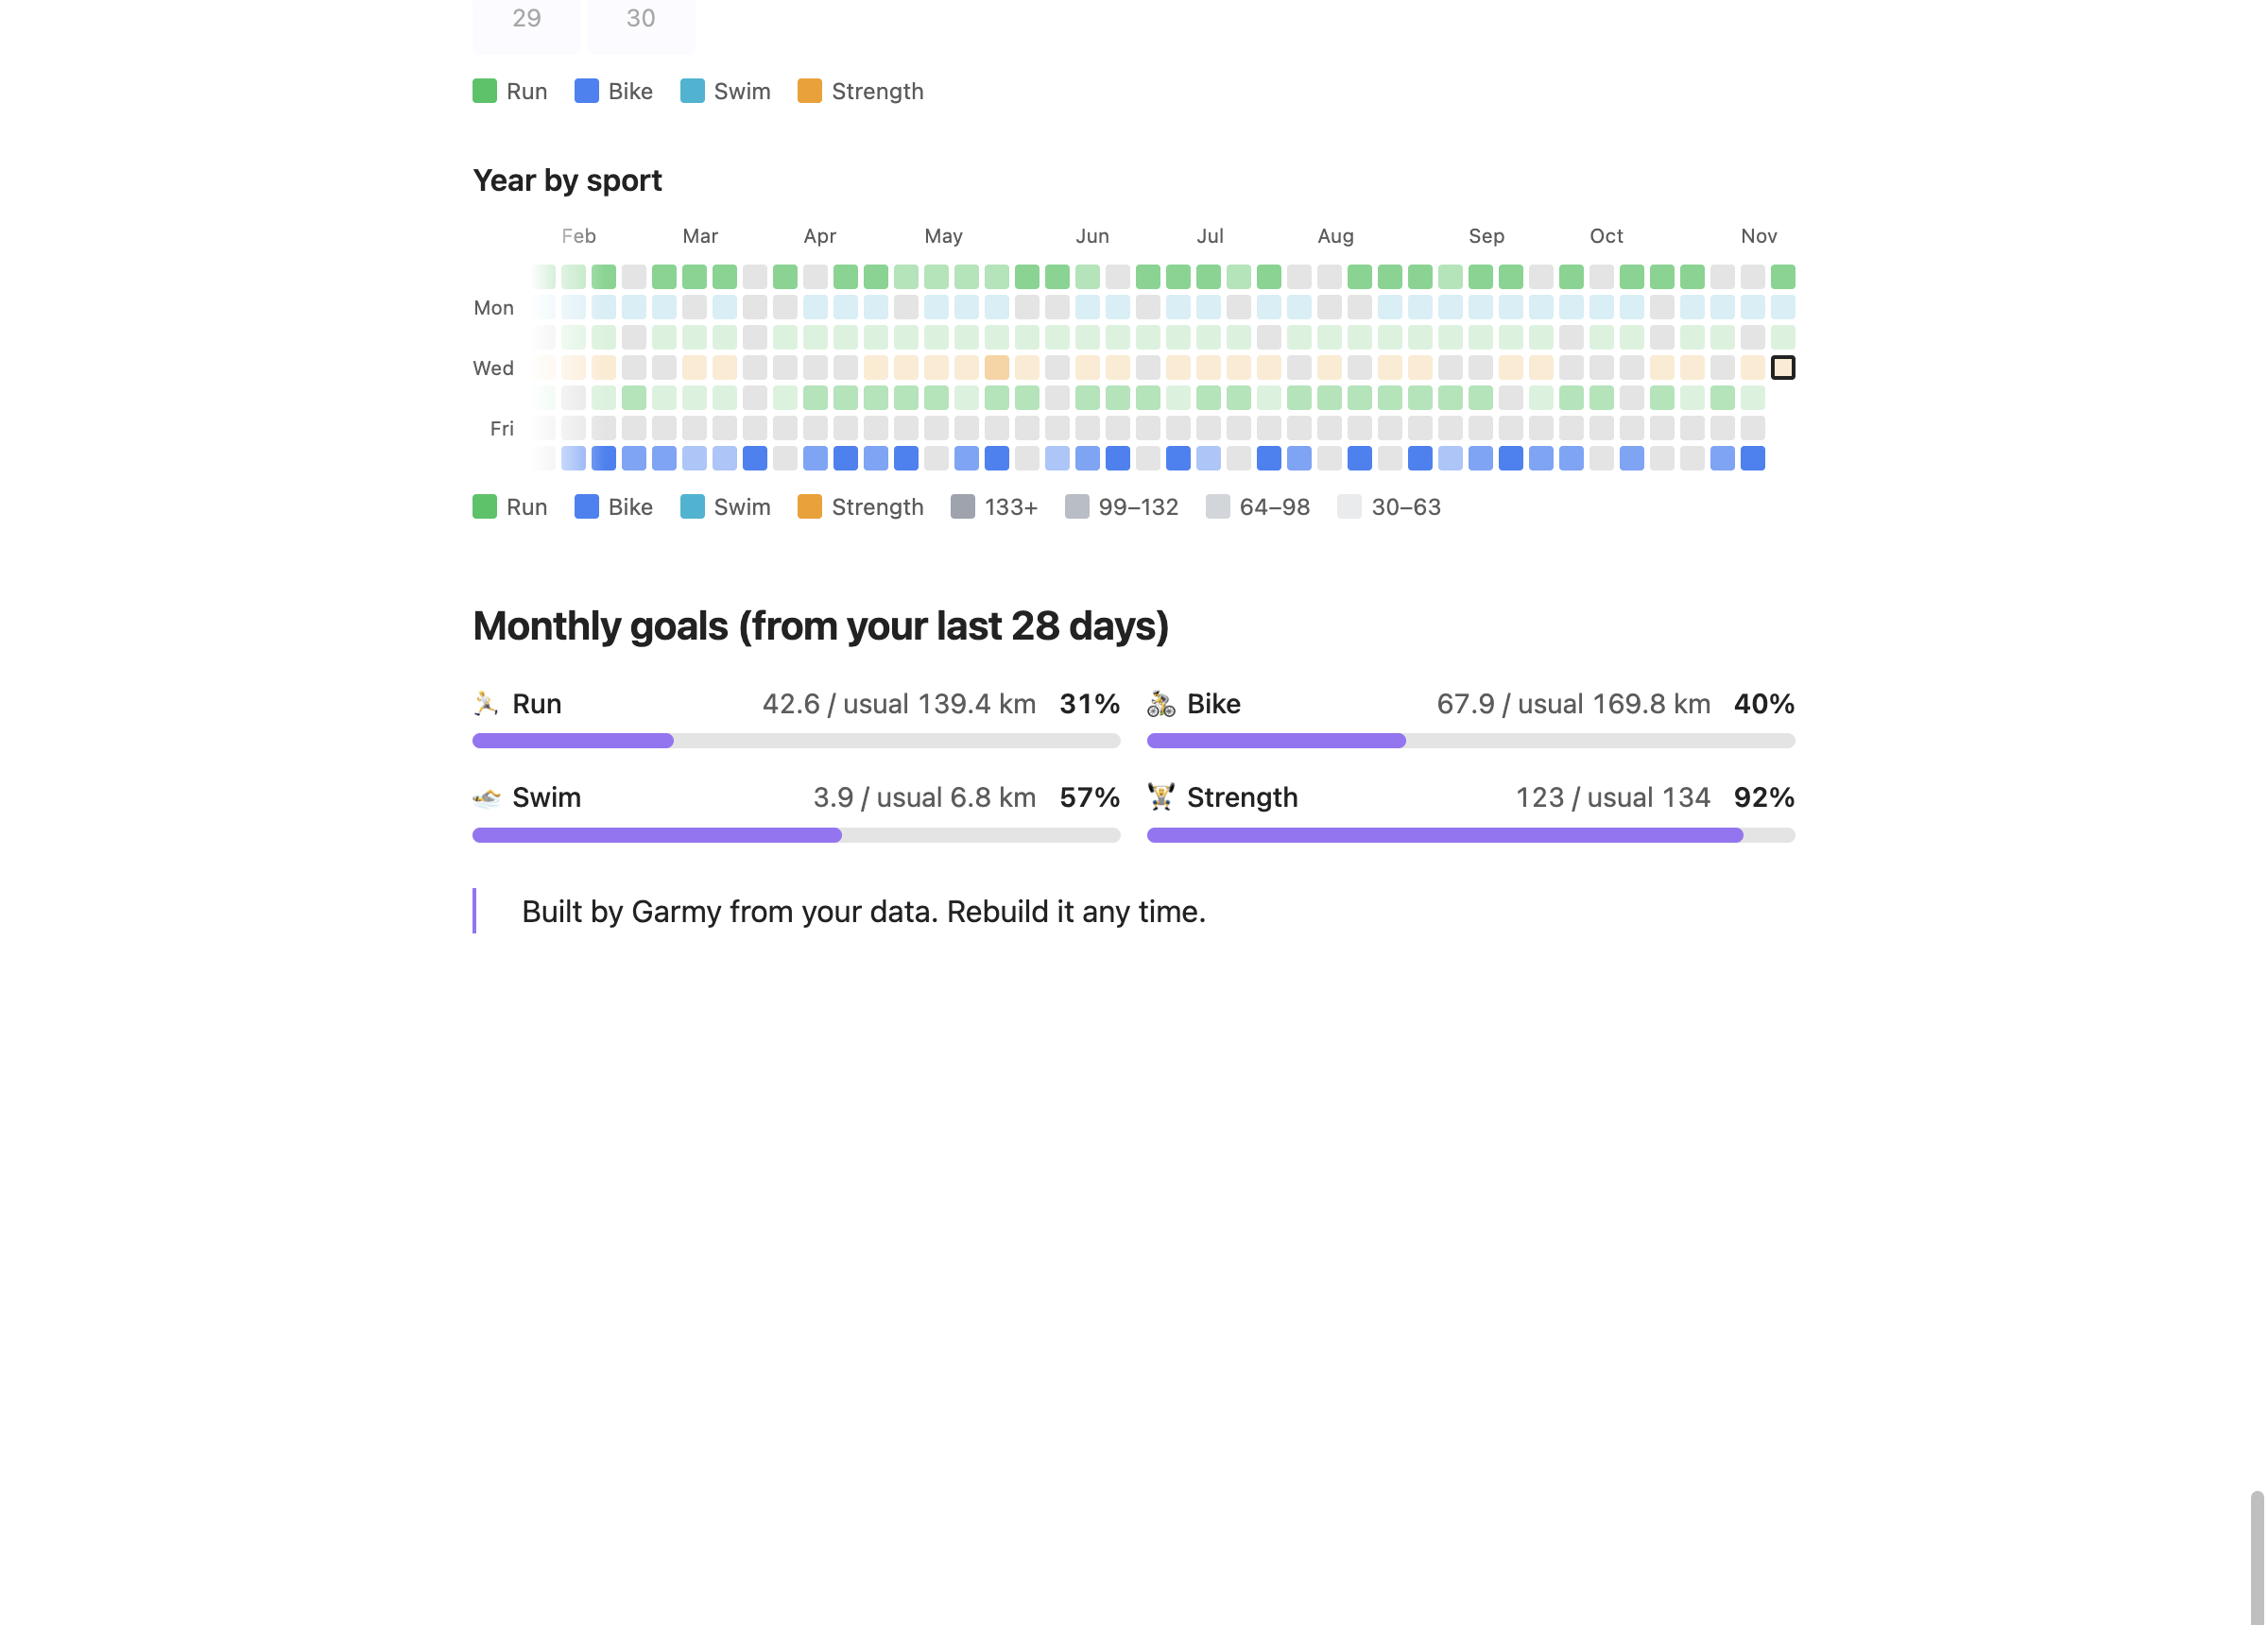
Two heatmaps follow. The month calendar needs 7 days of data, the year map 60. Each day is coloured by the sport with the most minutes that day. The heatmap guide goes through both.
5Monthly goals from your own numbers
Garmy sums each sport over your last 28 days, adds 10 percent and rounds up to a round number. That becomes the goal for the calendar month. It needs 28 days of data, and a sport with nothing in those 28 days gets no goal.
```progress
source: Garmy/data
period: month
columns: 2
items:
  - { label: Run, field: run_km, agg: sum, goal: 200, unit: " km", icon: 🏃 }
  - { label: Bike, field: bike_km, agg: sum, goal: 500, unit: " km", icon: 🚴 }
  - { label: Swim, field: swim_km, agg: sum, goal: 10, unit: " km", icon: 🏊 }
  - { label: Strength, field: strength_min, agg: sum, goal: 500, icon: 🏋️ }
```
6A countdown to the next race
In the wizard's Options, name a folder where every race is a note with a date property, such as Races. Garmy adds a countdown card.
---
date: 2027-05-16
---```countdown
columns: 2
items:
- { label: Next race, field: date, source: Races, pick: next, icon: 🏁 }
```pick: nextDashy readsdatein every note of the folder and counts to the soonest one still ahead. The card shows that note's name.source: RacesThe folder you gave the wizard.
If you leave the folder empty, the countdown is skipped.
Rebuild it as the season goes
The first dashboard after a few days of data has cards only. Run Garmy: Rebuild the dashboard in this note after a month and the bars, year map and goals appear. A sport you start later is picked up too, unless you switched it off in the wizard.
Related guides
A year of training days coloured by sport, a month calendar and weekly bars, from the minutes Garmy writes into your daily notes.
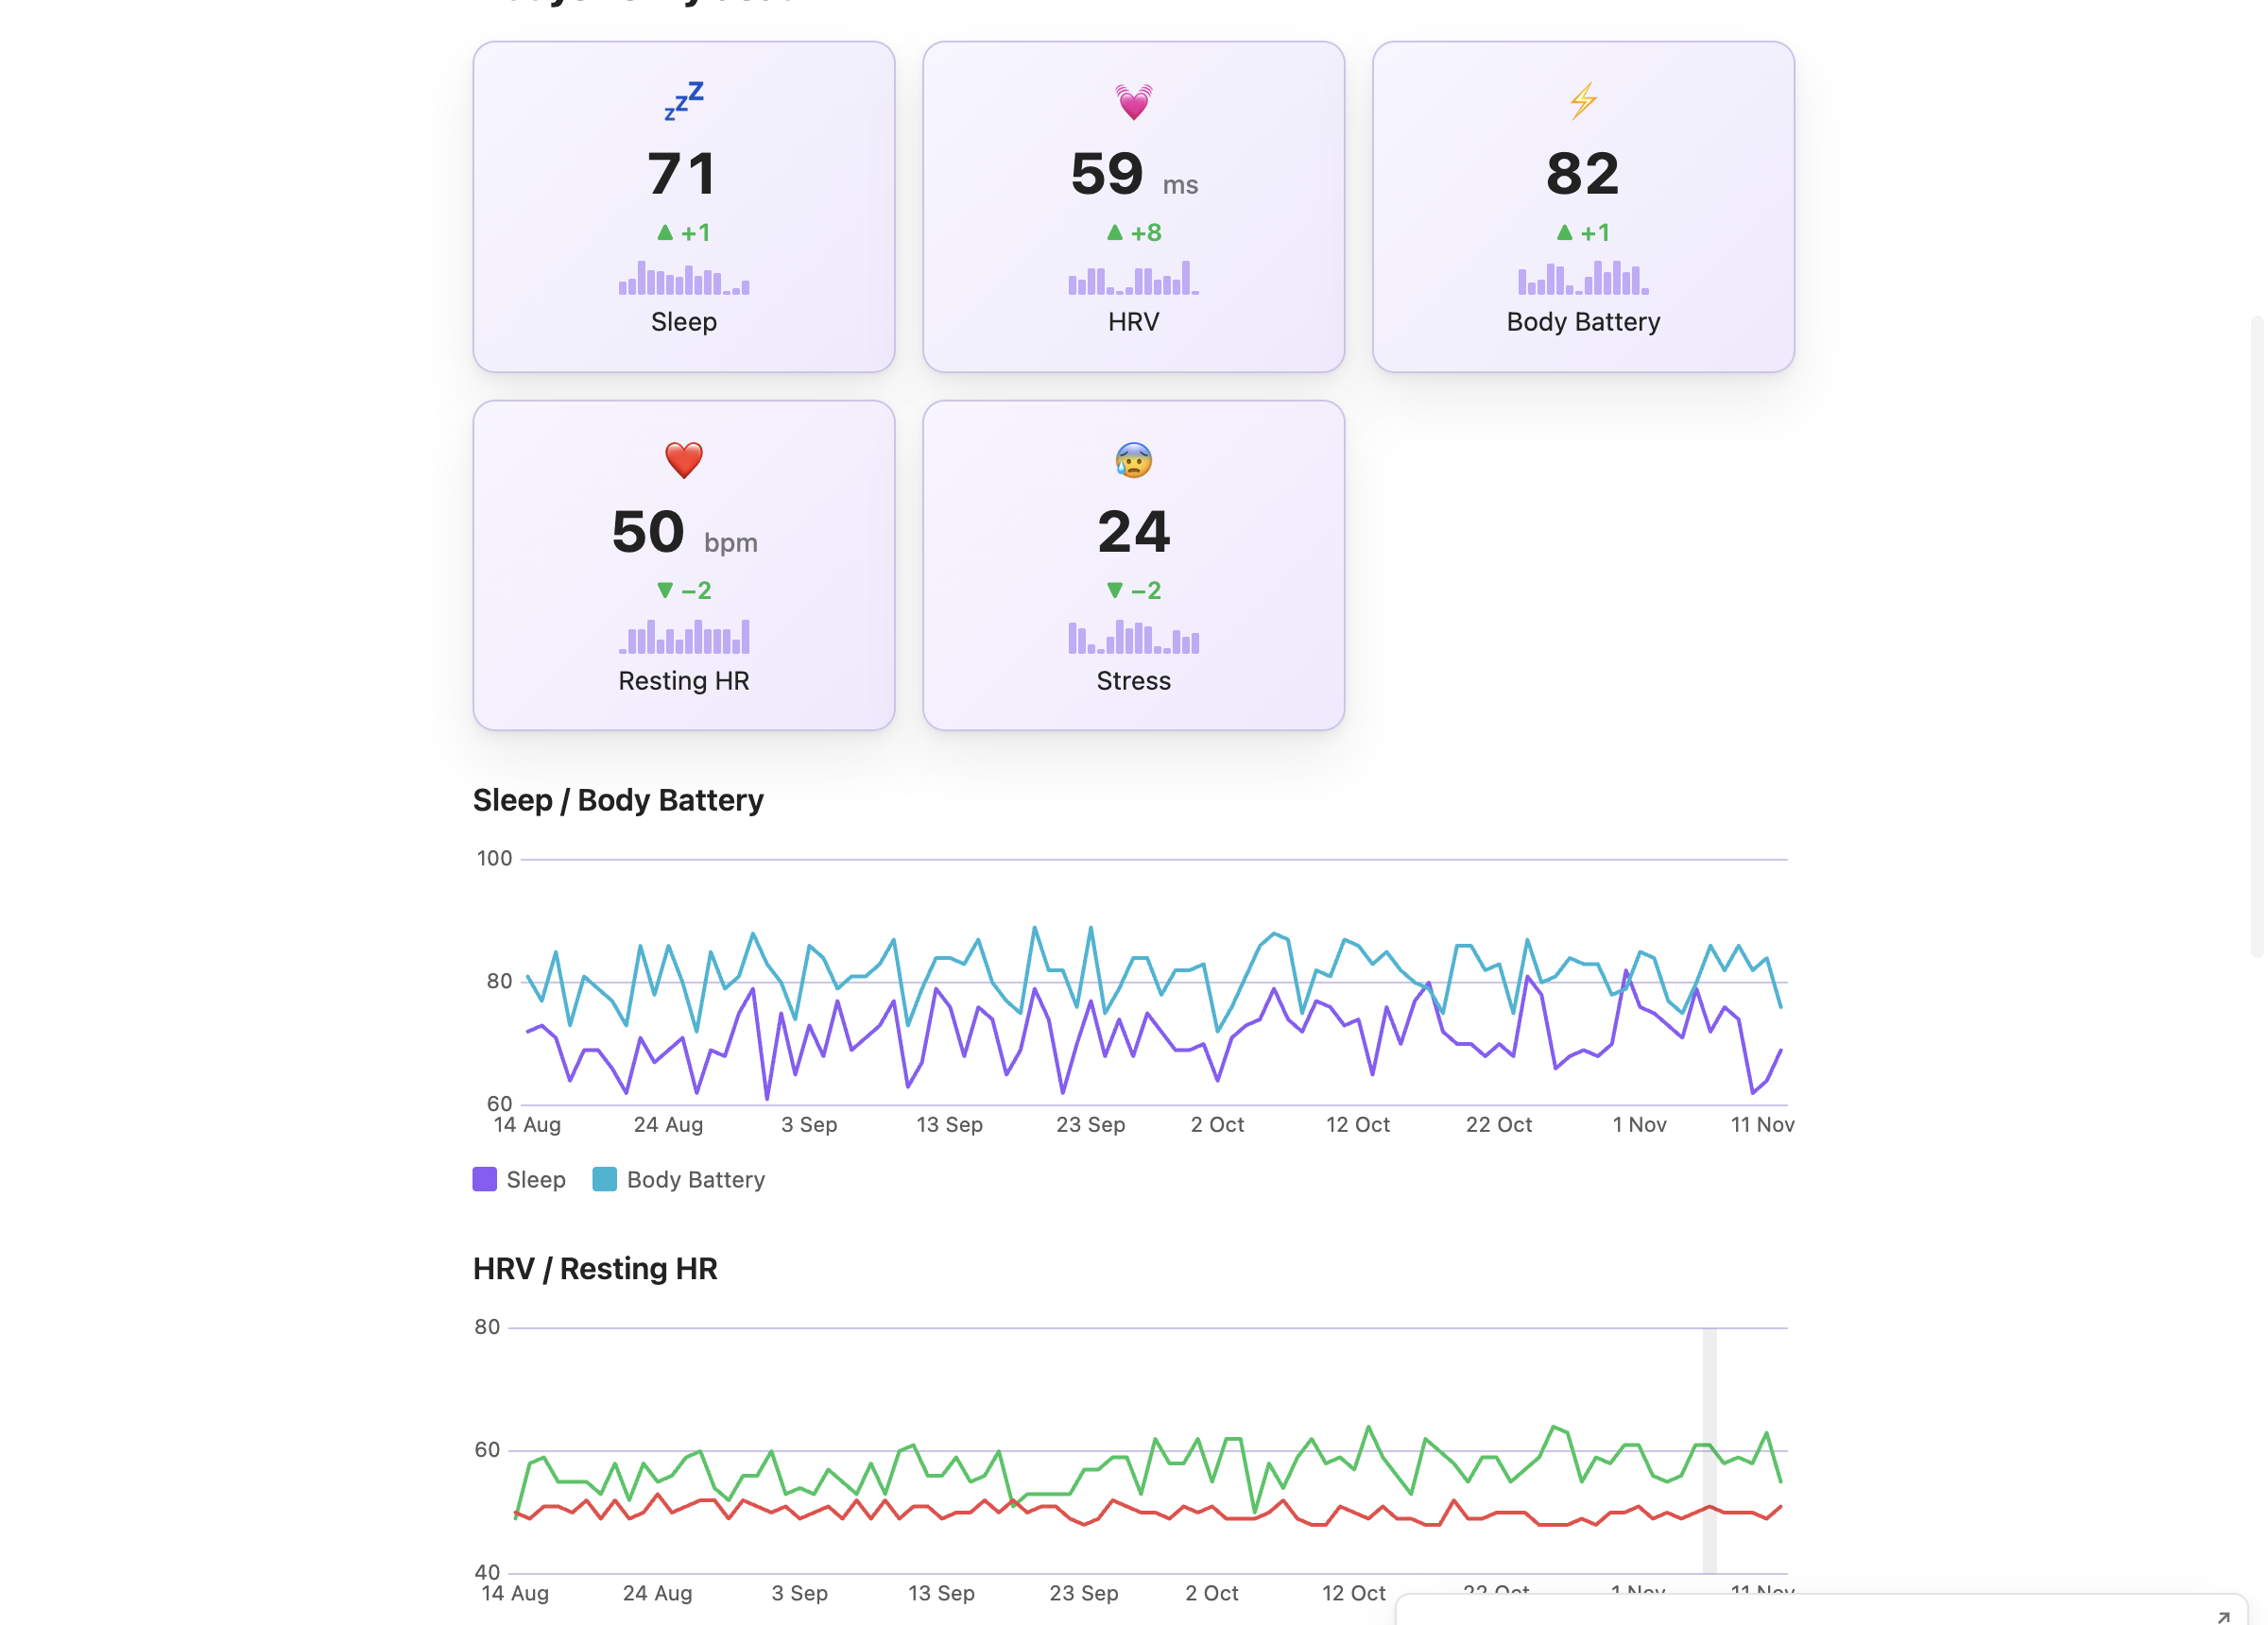
Sleep score, sleep duration, HRV, resting heart rate and Body Battery as cards and charts in one note, from your own Garmin data.
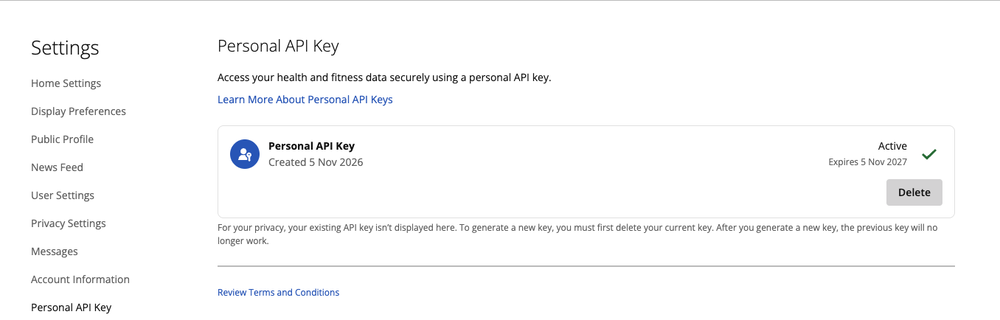
Where to find the key in Garmin Connect, how long it lasts, which numbers Garmy reads with it and which Garmin does not provide.
Install Garmy and Dashy, then run the wizard on your own activities.