A weekly training heatmap in Obsidian
run_min bike_min swim_min strength_minA year of training days coloured by sport, this month as a calendar and minutes per week as bars. All three come from the minutes Garmy writes into your daily notes. Garmy writes the blocks, and this page shows what each key does so you can change them.
1Minutes per sport, one number per day
Garmy writes run_min, bike_min, swim_min and strength_min into the day notes. A day without that sport has no property, so its cell stays empty. That is the whole input: every grid and bar on this page reads those four numbers.
---
strength_min: 50
run_min: 45
run_km: 8.2
---
Example values.
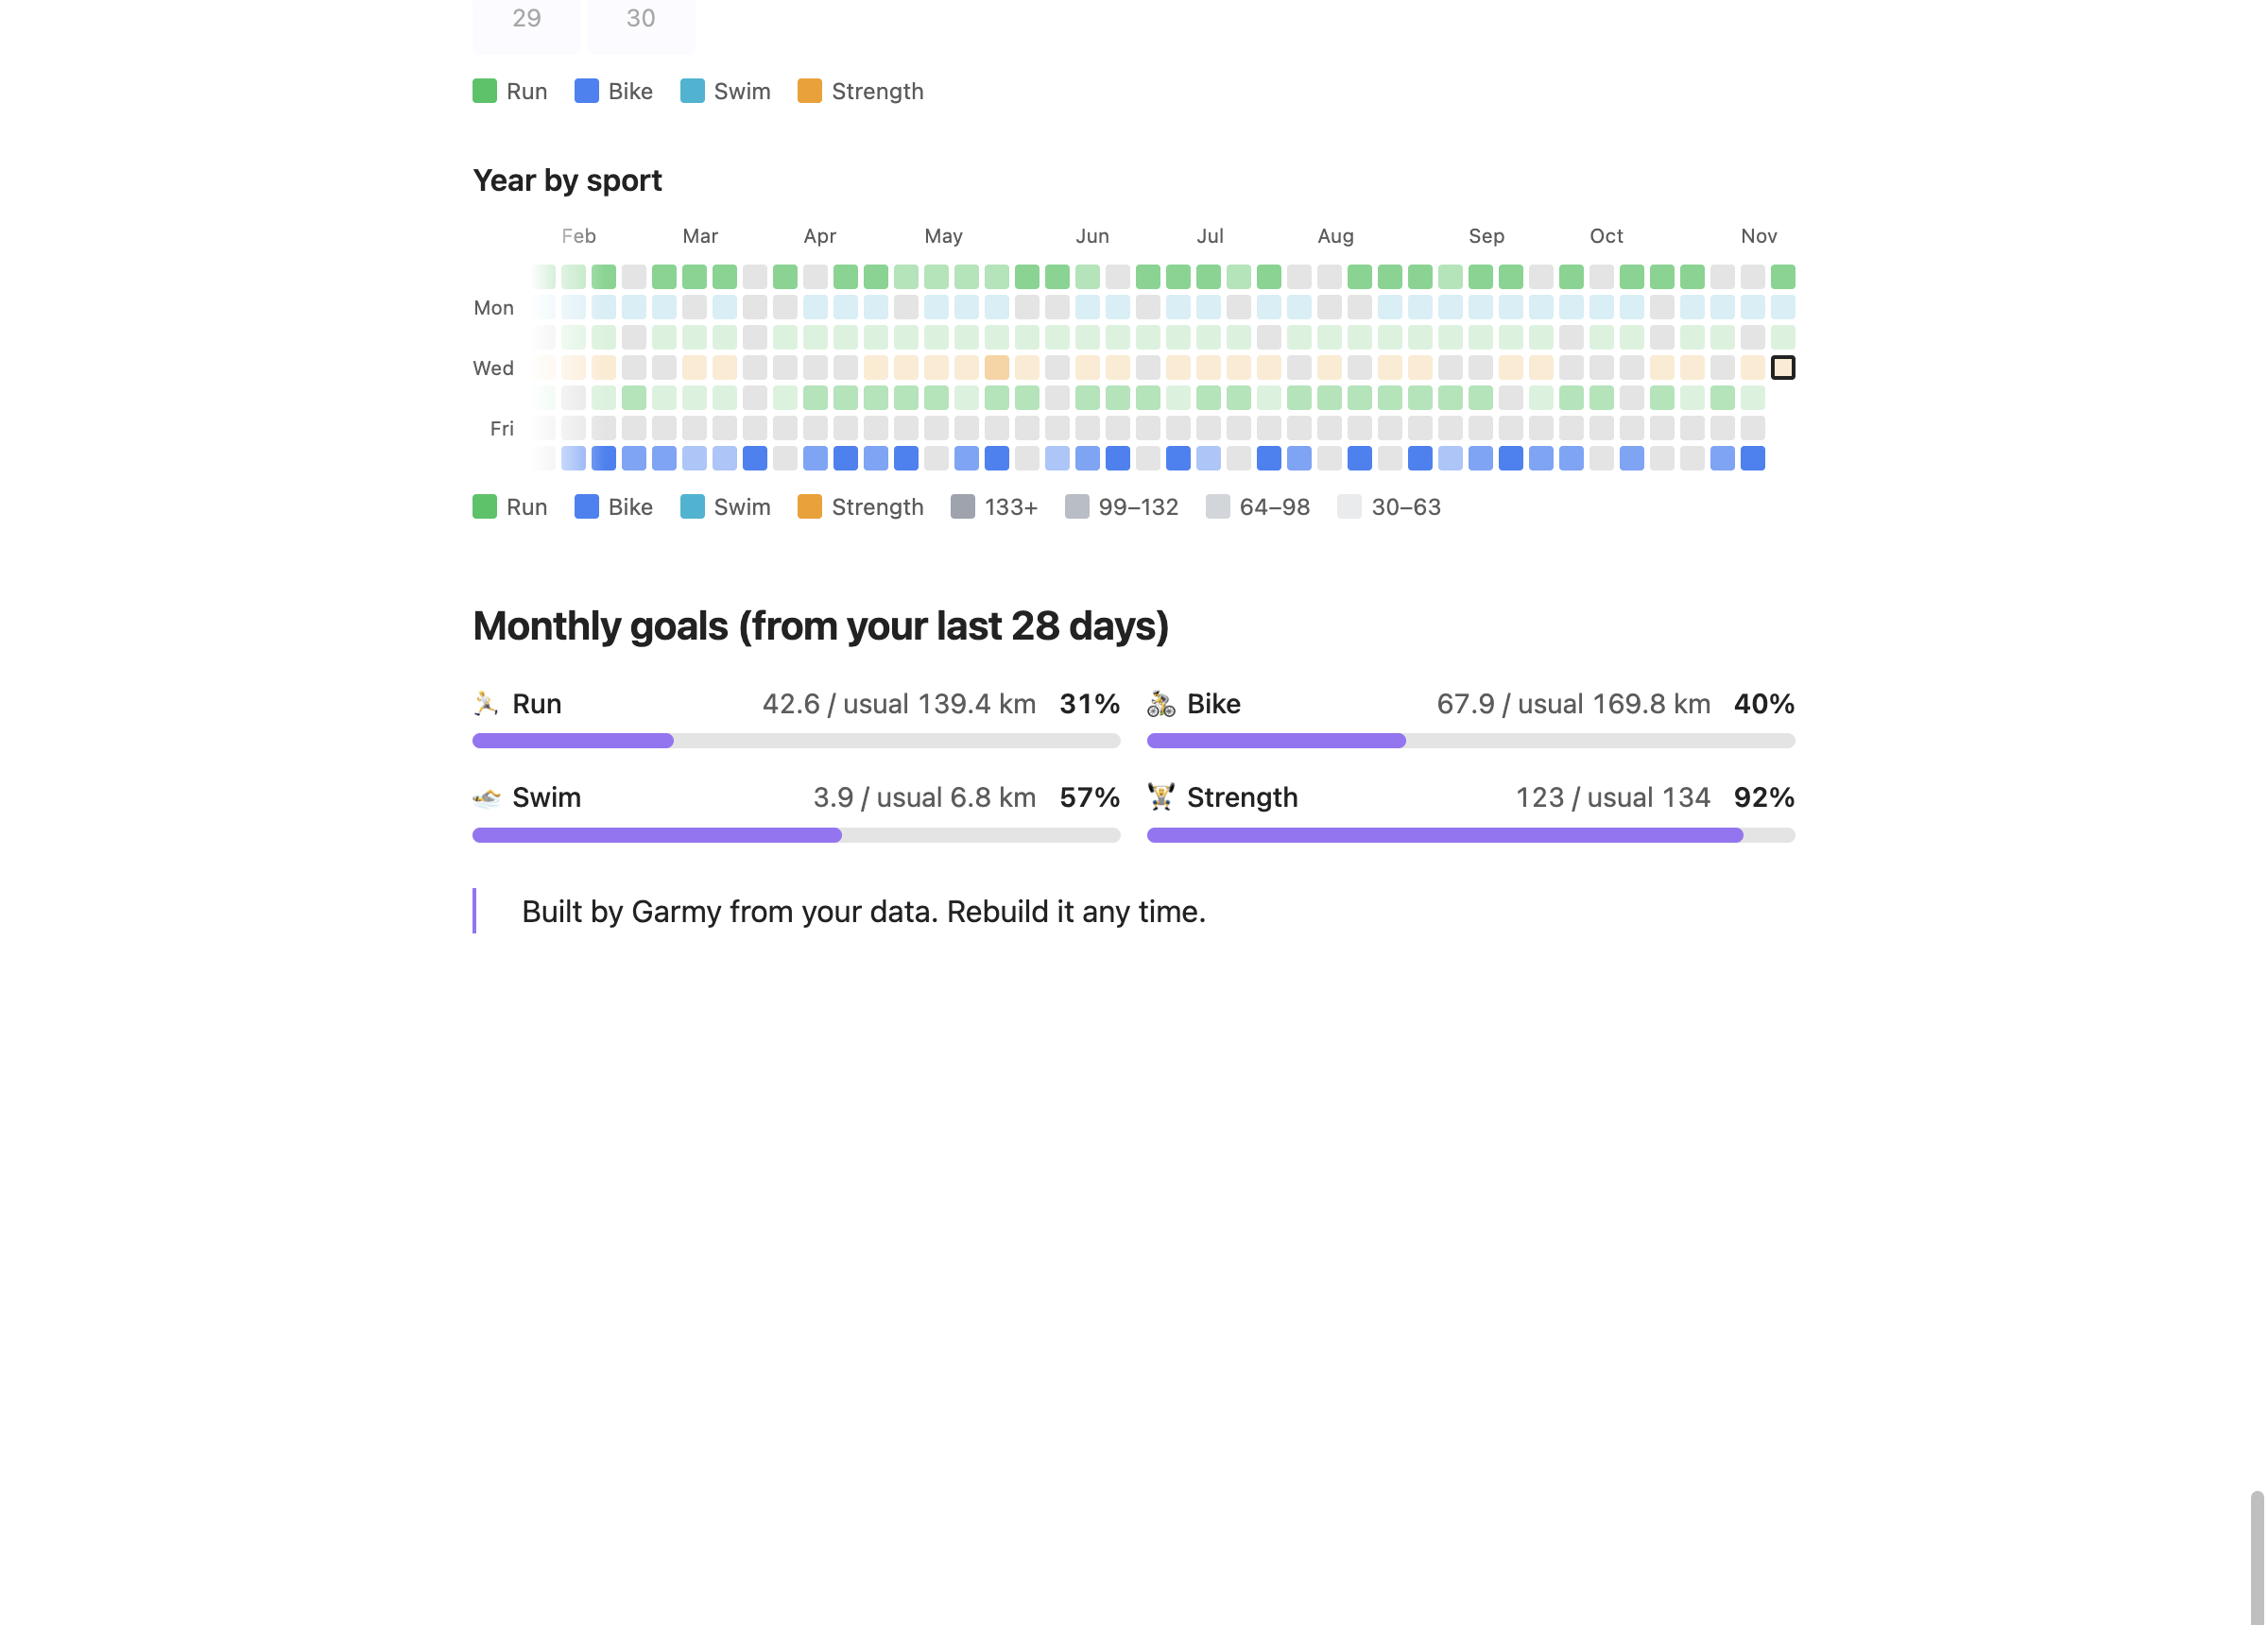
2A year, coloured by sport
One grid over the last 365 days. Each sport has a colour, and the sport with the most minutes on a day paints that day.
```heatmap
source: Garmy/data
range: 365d
pick: max
title: Year by sport
layers:
  - { field: run_min, color: green, label: Run }
  - { field: bike_min, color: blue, label: Bike }
  - { field: swim_min, color: cyan, label: Swim }
  - { field: strength_min, color: orange, label: Strength }
```layersOne line per sport. Acolorand alabeleach.pick: maxOn a day with two sports, the one with more minutes paints the cell. Compare minutes with minutes. The tooltip still lists every sport with a value that day.range: 365dA rolling year ending today, in one grid, instead of one grid per calendar year.
3This month as a calendar
The month view puts each day's number in a calendar cell and a dot under it for every sport trained that day, in the sport's colour. Days after today are dimmed.
```heatmap
source: Garmy/data
range: month
layout: calendar
pick: max
title: Month by day
layers:
  - { field: run_min, color: green, label: Run }
  - { field: bike_min, color: blue, label: Bike }
  - { field: swim_min, color: cyan, label: Swim }
  - { field: strength_min, color: orange, label: Strength }
```
range: monthThe current calendar month.layout: calendarA calendar instead of a year grid. It works with a window of one month or one week.

4Weekly bars
Minutes per sport per week, from the same four numbers. With 28 days of data or more Garmy groups the bars by week.
```dashy-chart
source: Garmy/data
type: bar
bucket: week
range: 119d
agg: sum
title: Training minutes
series:
  - { field: run_min, label: Run, color: green }
  - { field: bike_min, label: Bike, color: blue }
  - { field: swim_min, label: Swim, color: cyan }
  - { field: strength_min, label: Strength, color: orange }
```
agg: sum adds the minutes of the days in each week. A week without training stays an empty slot.
Variations
One sport
Running only, one colour, shaded by minutes.
```heatmap
source: Garmy/data
field: run_min
color: green
range: 365d
title: Running
```
Half a year
The same sport layers over 182 days, a better fit for a narrow pane.
```heatmap
source: Garmy/data
range: 182d
pick: max
title: Year by sport
layers:
  - { field: run_min, color: green, label: Run }
  - { field: bike_min, color: blue, label: Bike }
  - { field: swim_min, color: cyan, label: Swim }
  - { field: strength_min, color: orange, label: Strength }
```
Where to paste it
These blocks work in any note, not only the dashboard Garmy makes. Keep source: Garmy/data pointing at your day notes, and change it if you moved them in settings. Edit colours and labels freely. A rebuild only touches the part of a note between Garmy's two comment markers, so a heatmap you pasted elsewhere stays as you left it.
Related guides
Run, bike, swim and strength per week, a month calendar, a year map by sport and monthly goals, built from your Garmin activities.
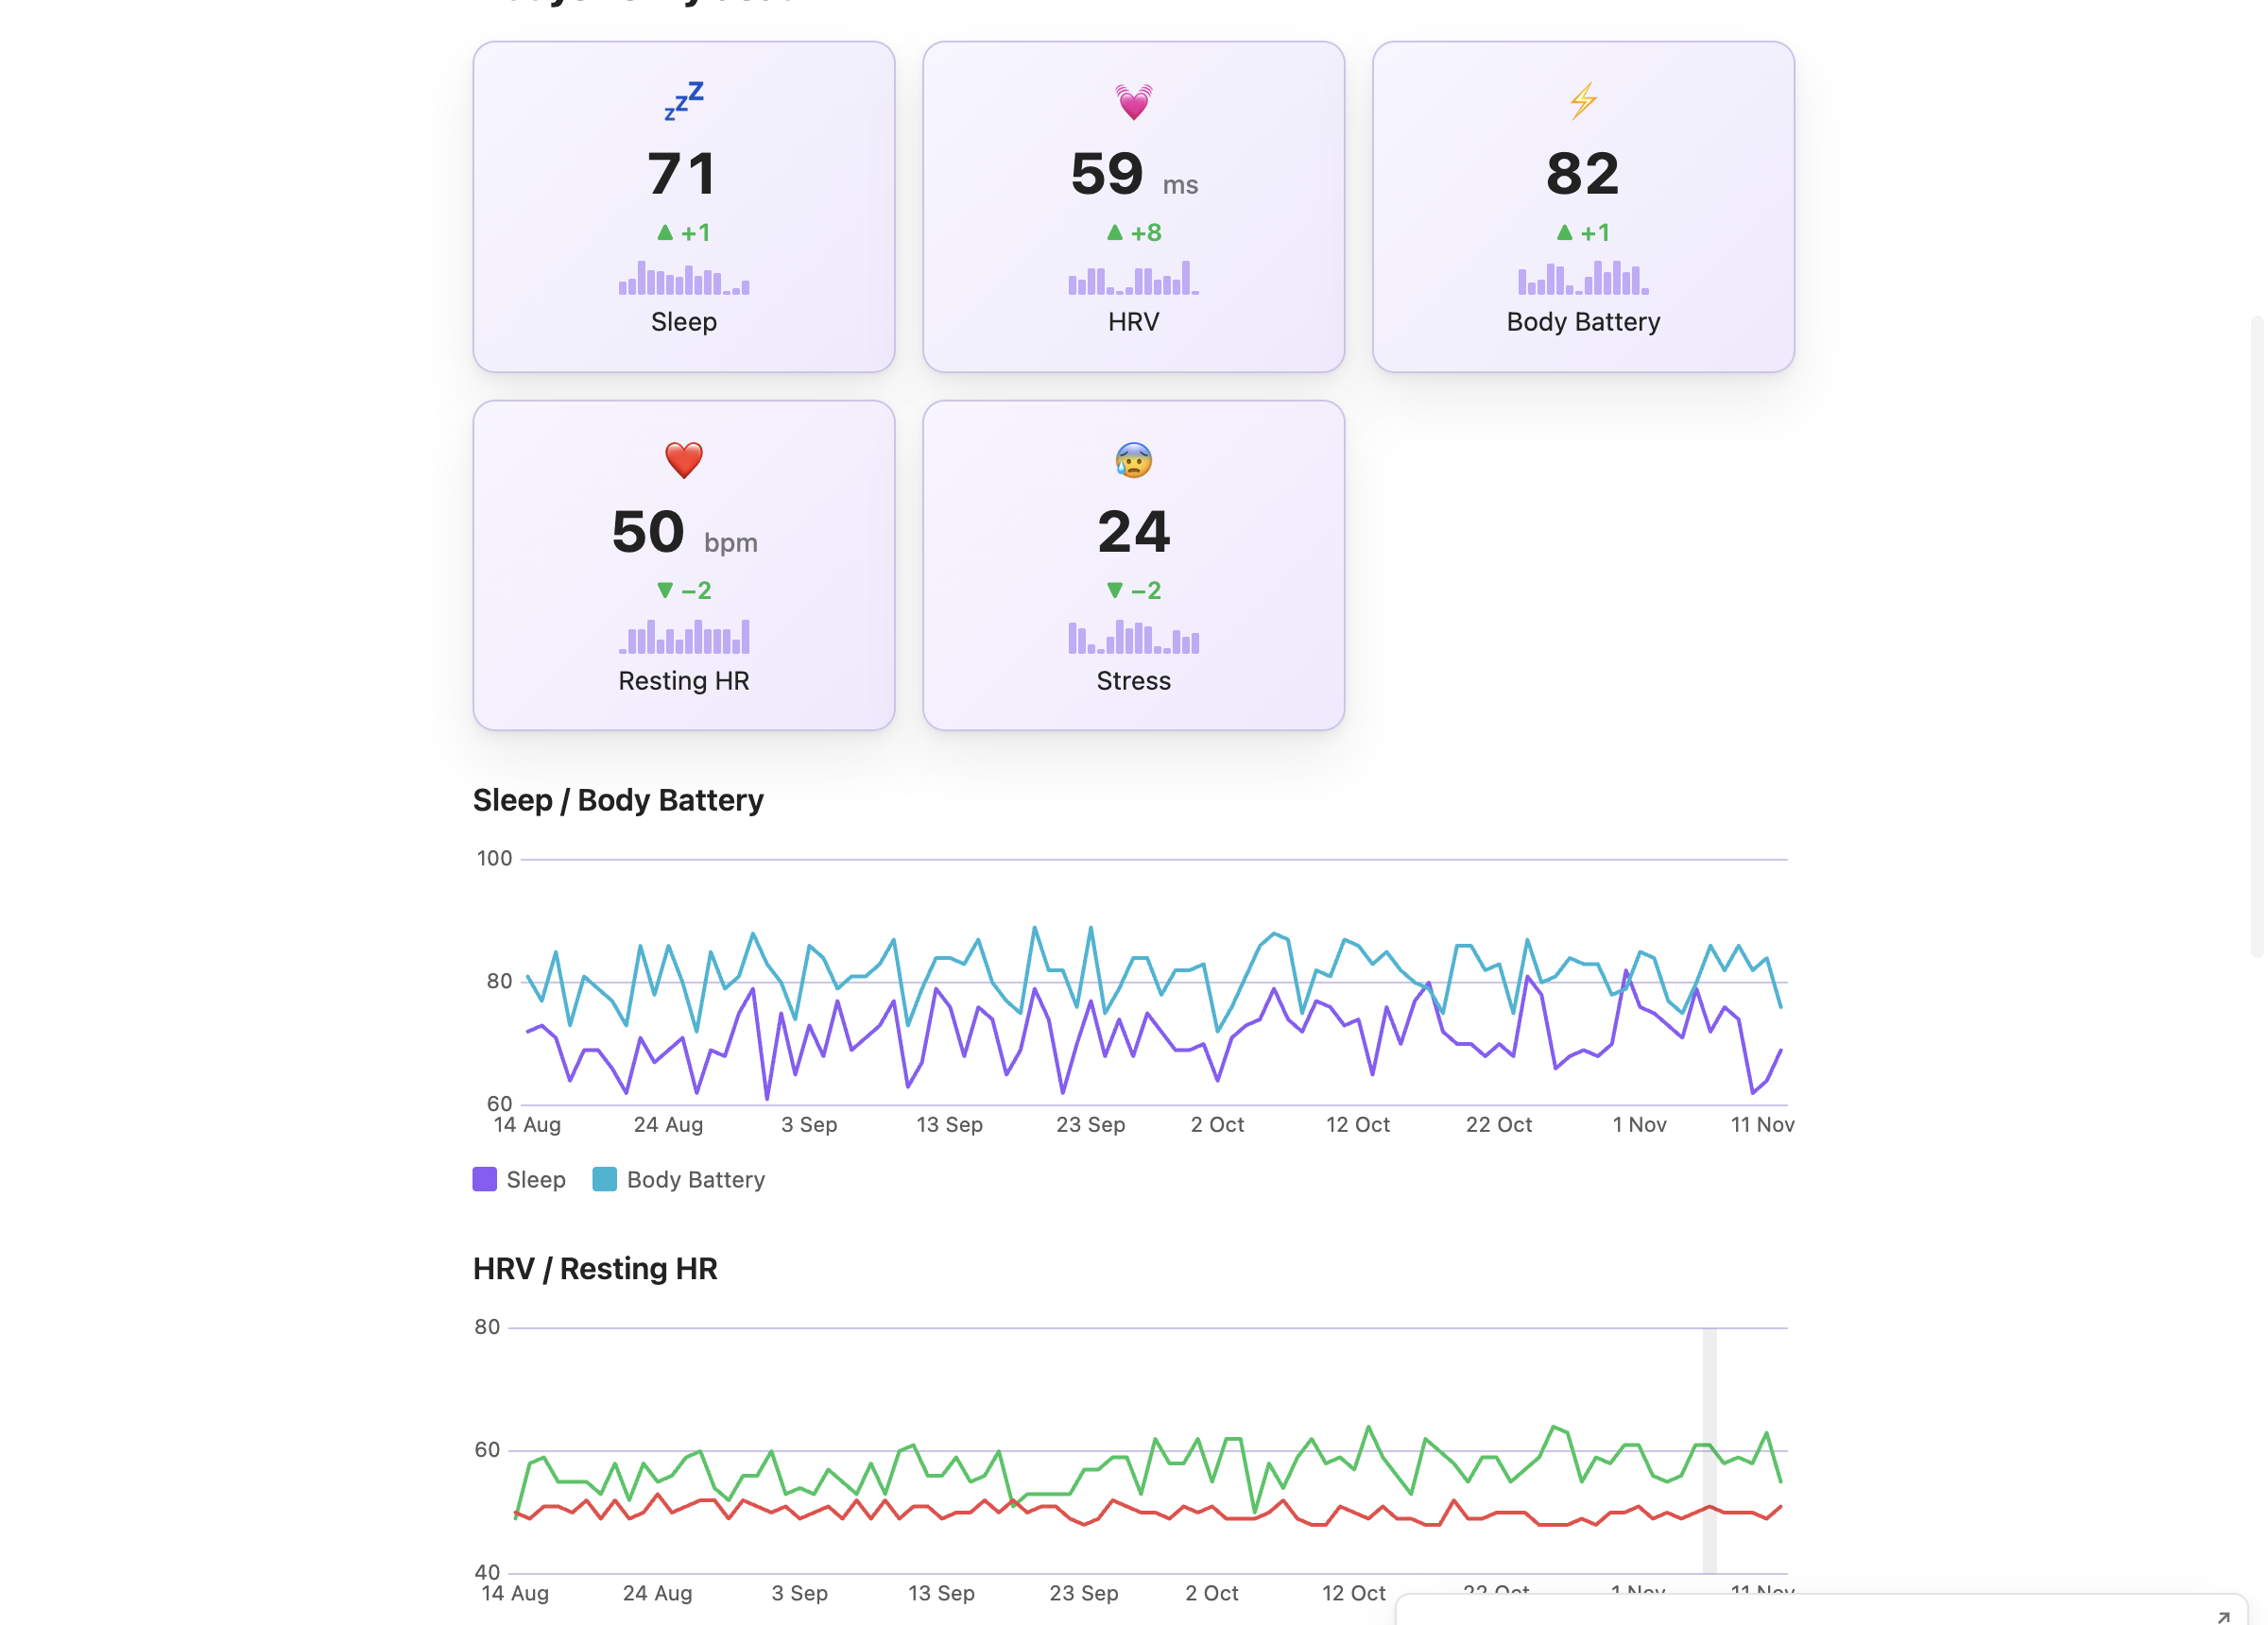
Sleep score, sleep duration, HRV, resting heart rate and Body Battery as cards and charts in one note, from your own Garmin data.
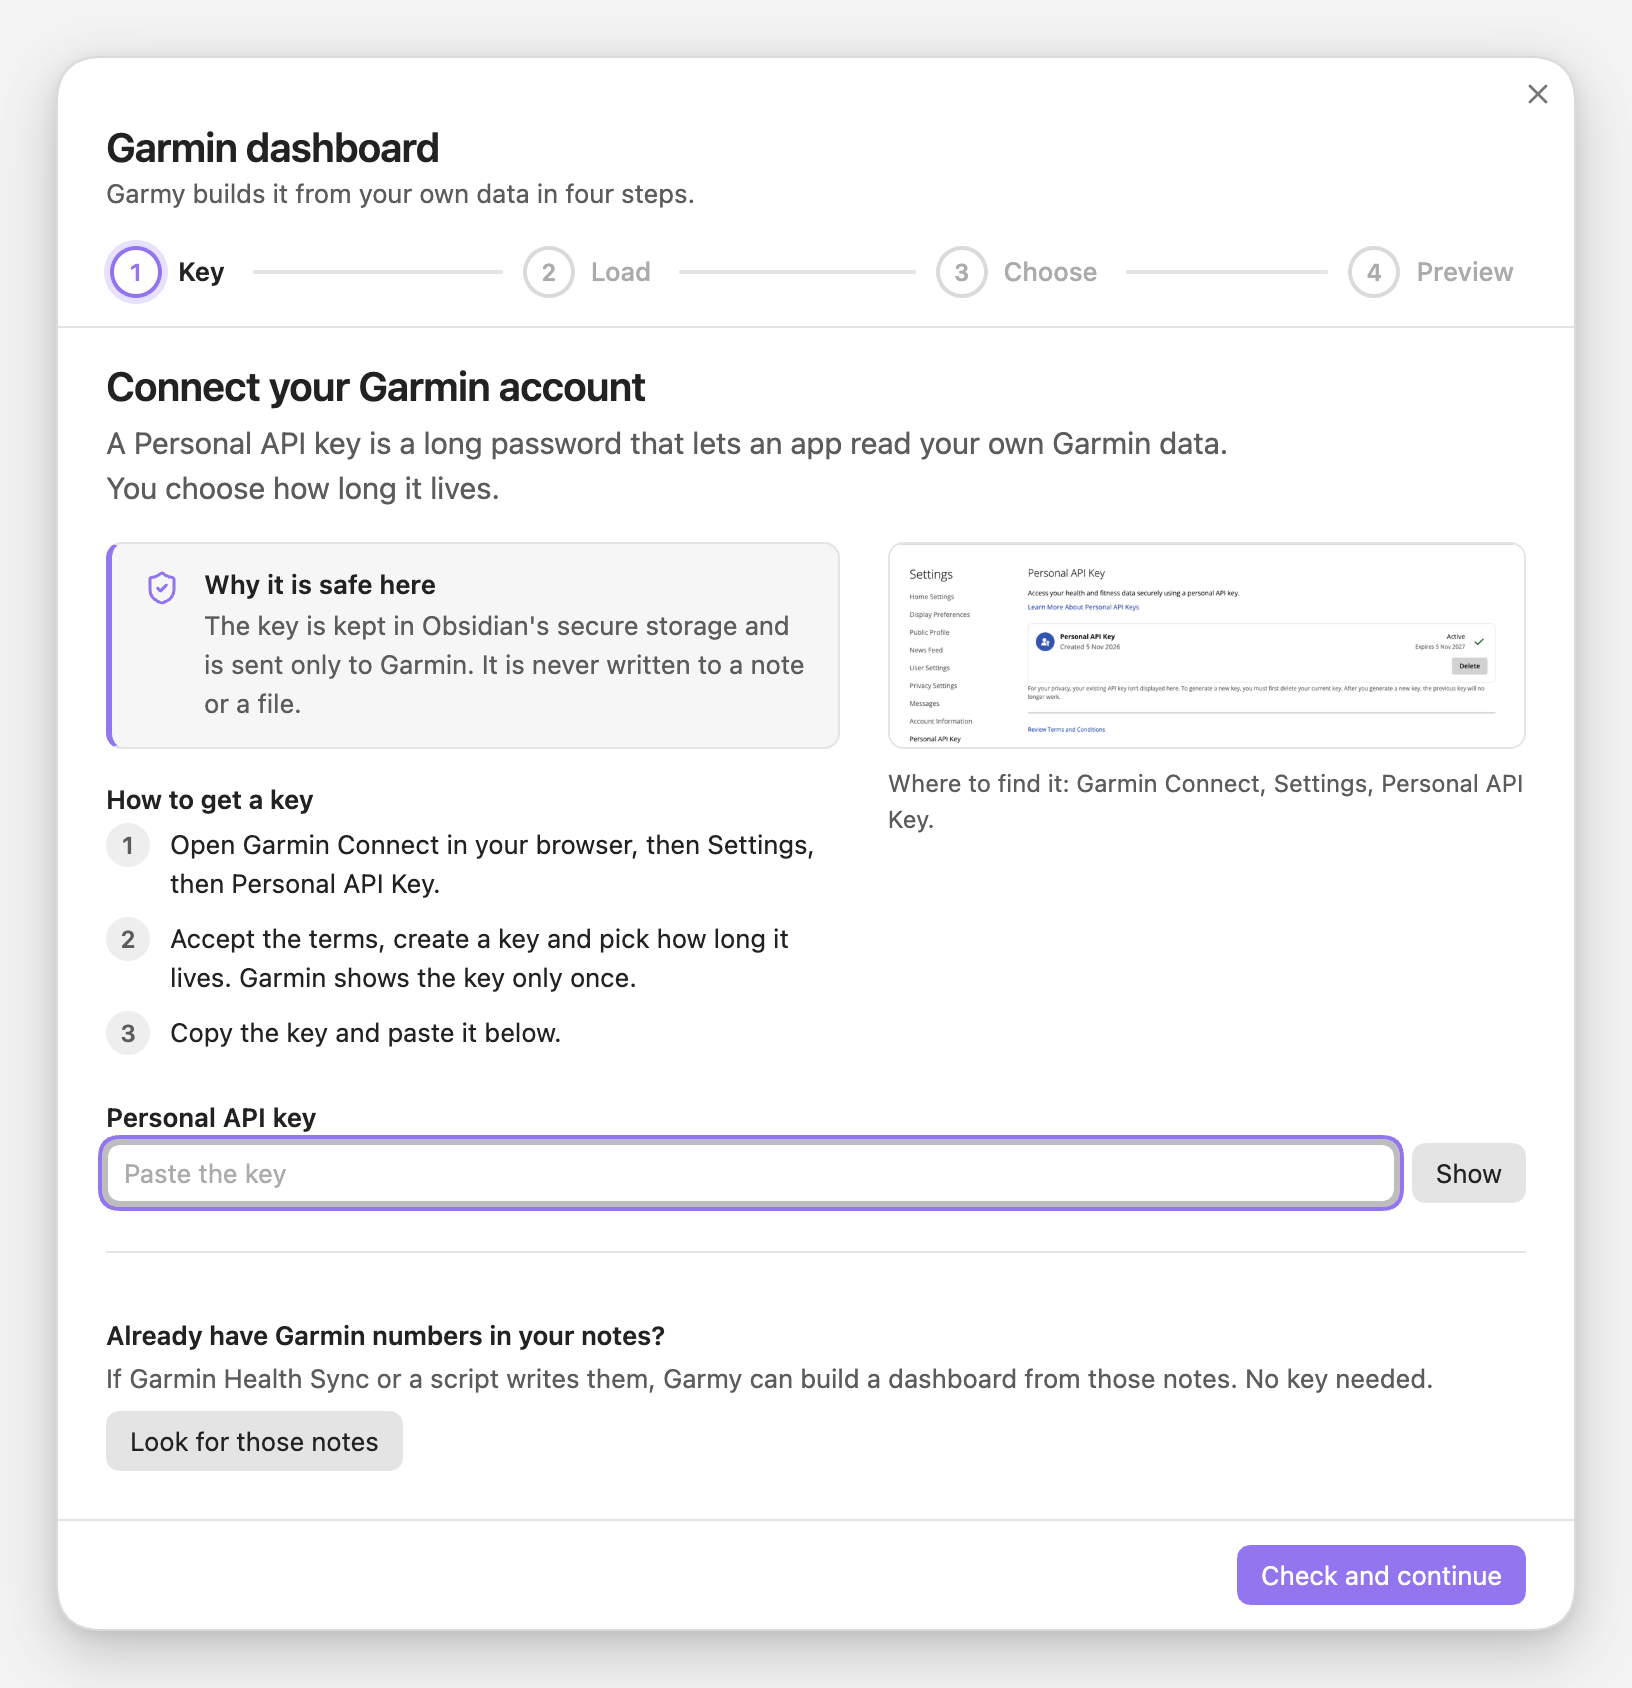
Two ways to get Garmin numbers into Obsidian notes. What Garmy does, what it leaves out, and how it works with notes Health Sync already wrote.
Install Garmy and Dashy, load your history and the heatmaps are in the dashboard.