Garmin sleep and HRV dashboard in Obsidian
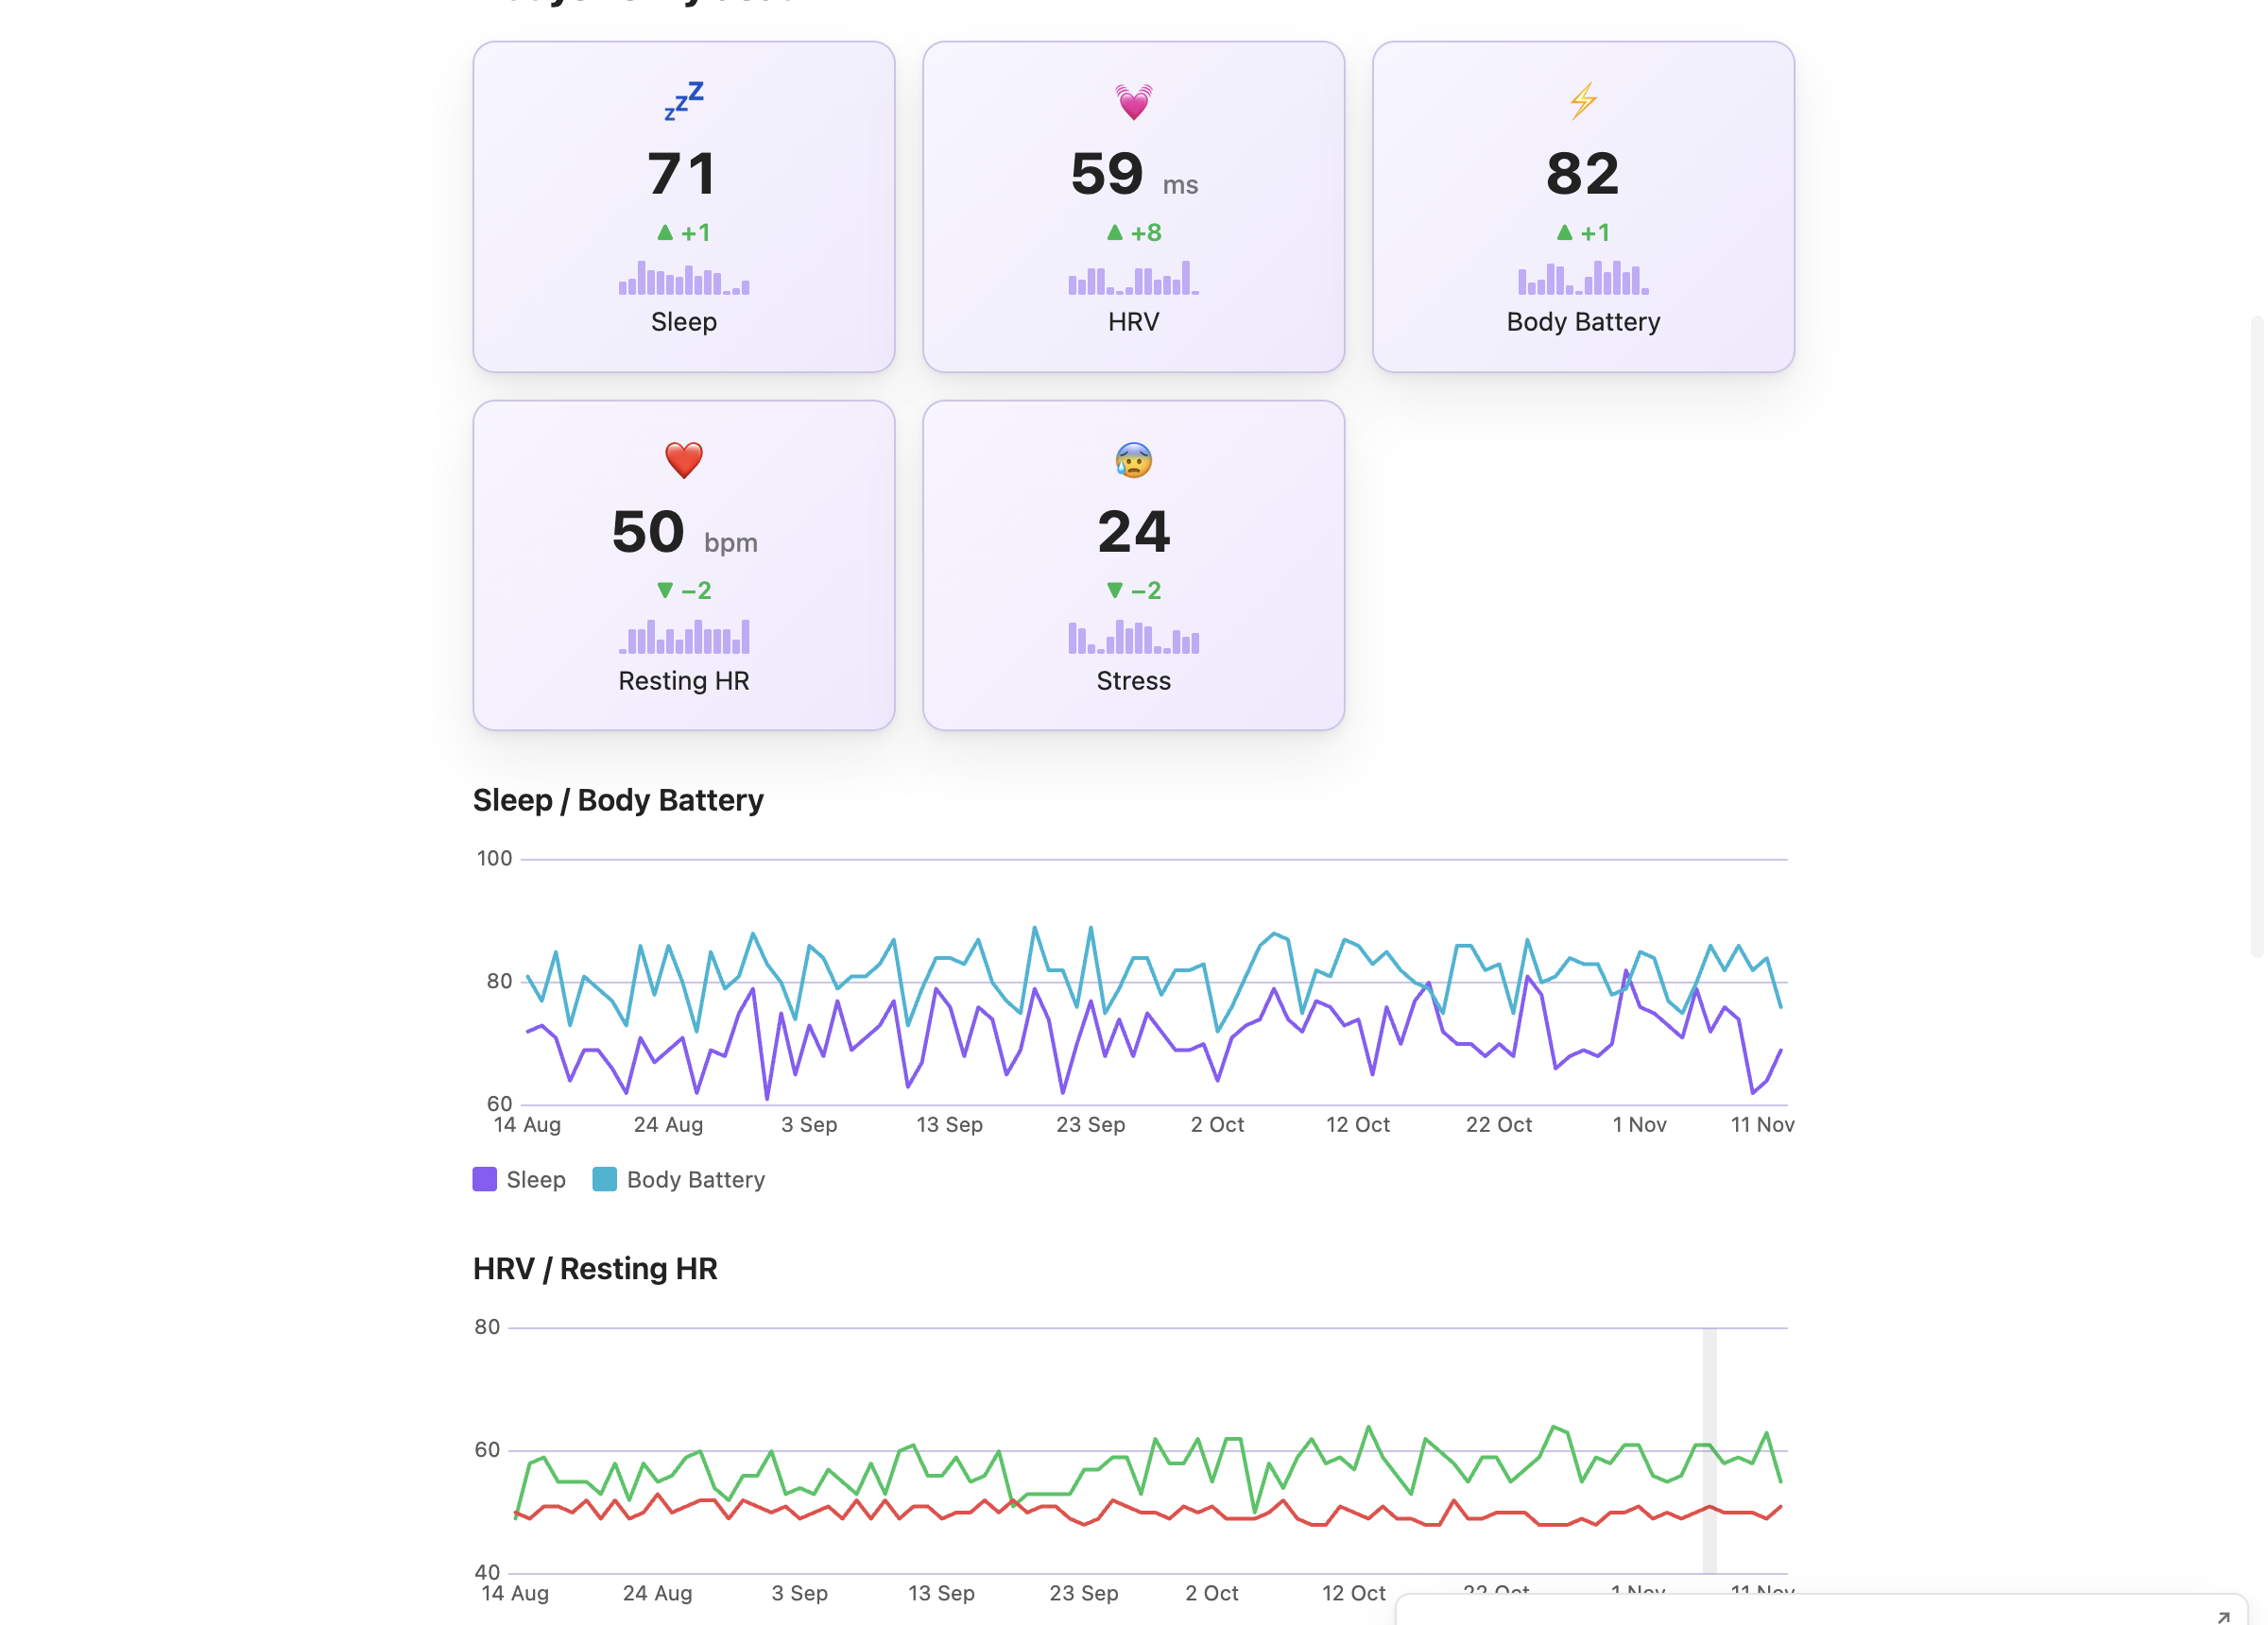
sleep_score sleep_duration hrv resting_hr body_battery stressSleep score, sleep duration, HRV, resting heart rate, Body Battery and stress, as cards and charts in one Obsidian note, from your own Garmin data. Garmy writes the blocks. This page shows what they are, so you can read and edit them.
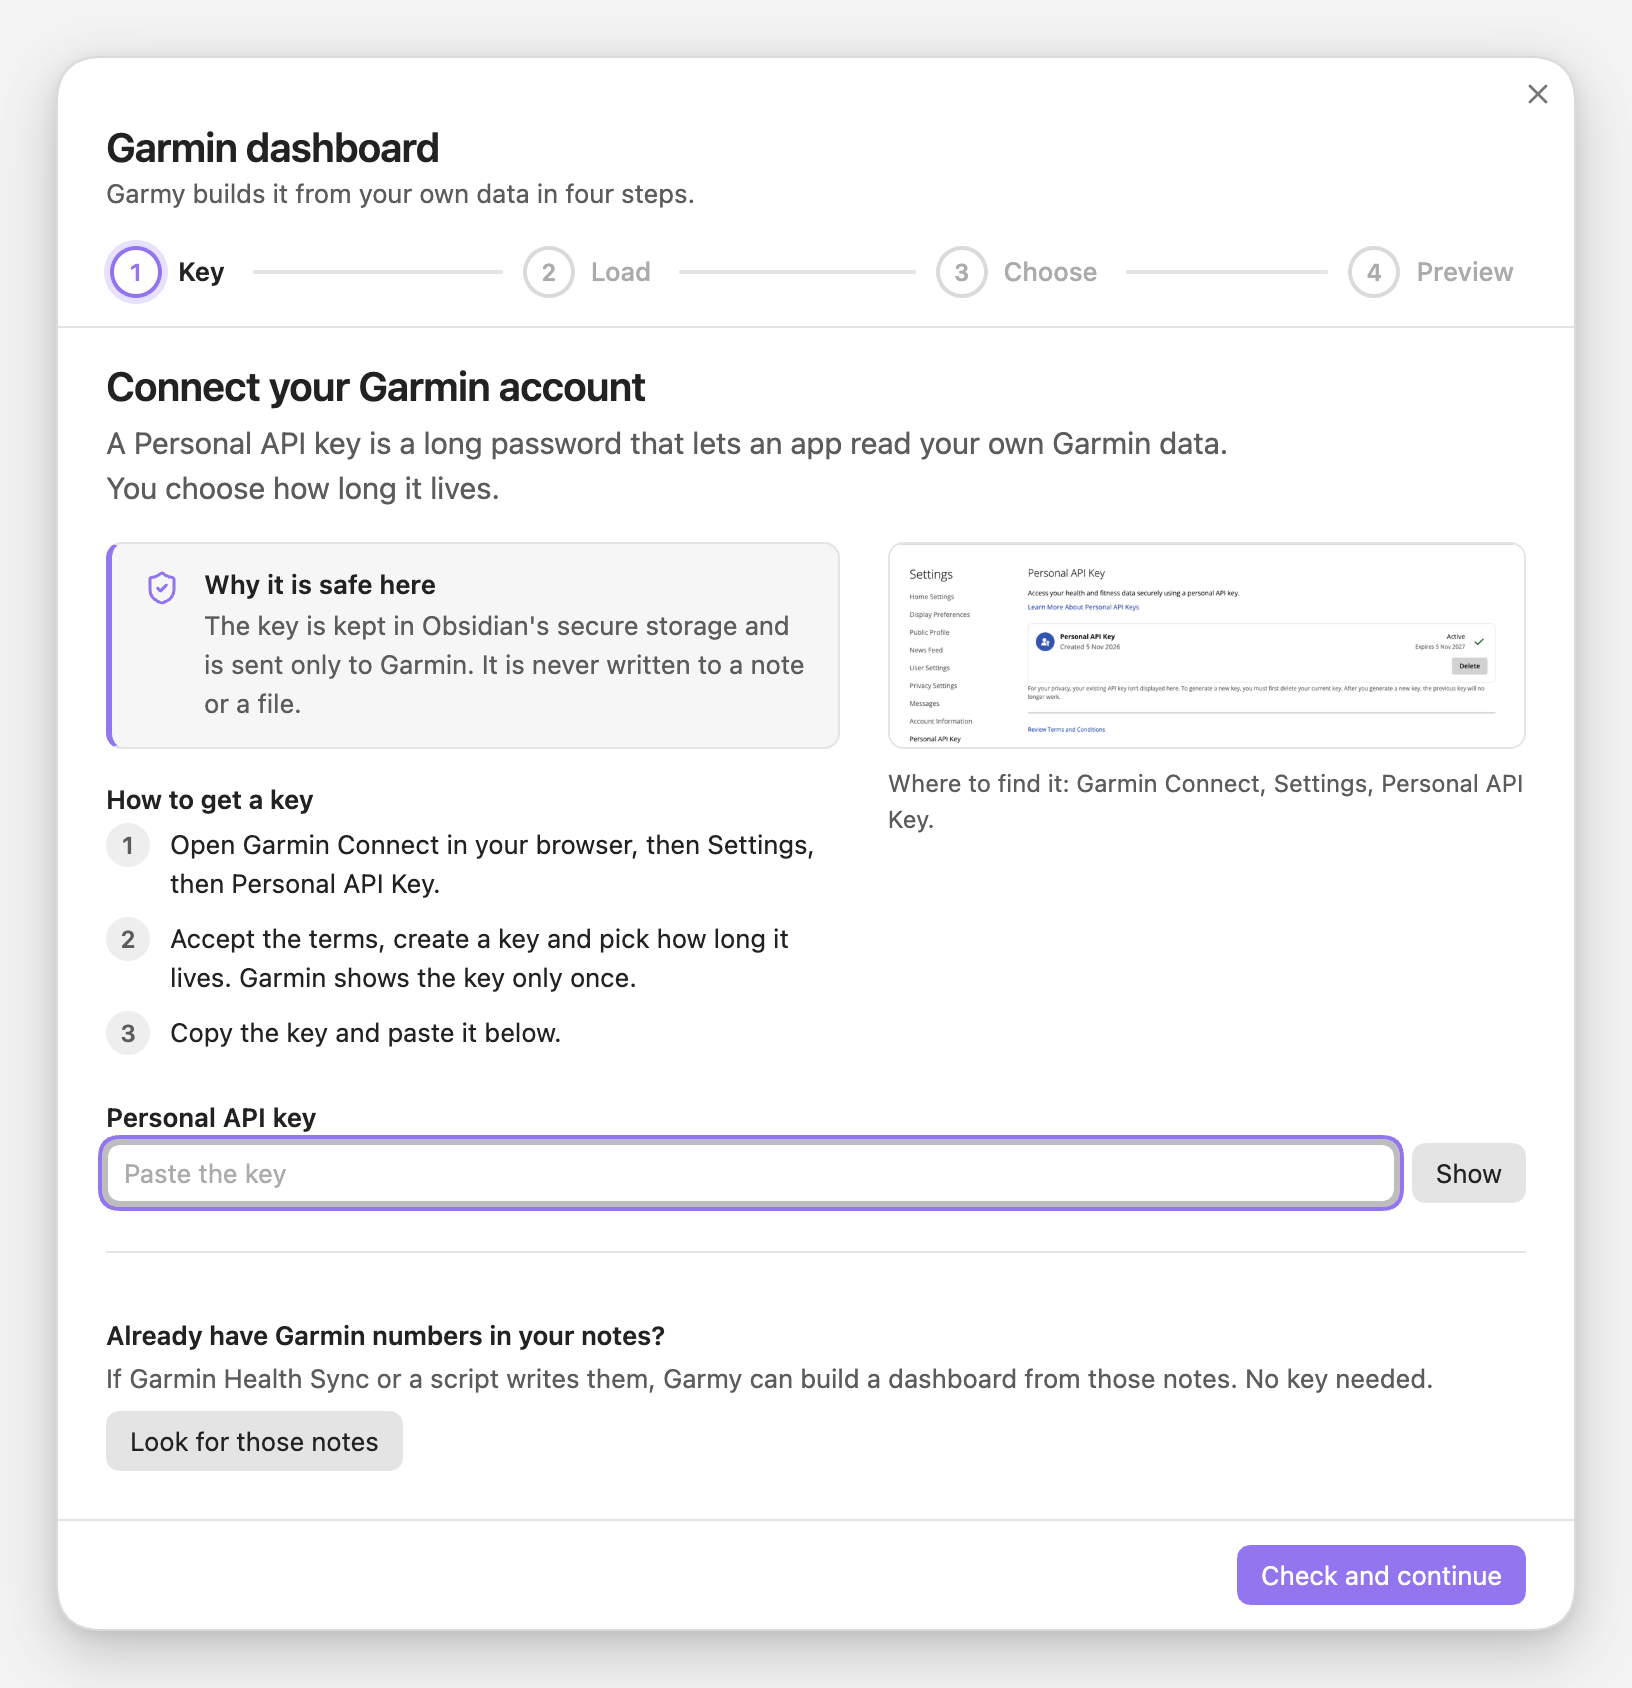
1Install Garmy and Dashy, make a key
Install Garmy and Dashy from Community plugins. Garmy needs a Garmin Personal API key, a long password that lets an app read your own Garmin data. The key guide shows where to create it.
2Load a year of days
Run Garmy: Build a Garmin dashboard, paste the key and pick a period: 30 days, 90 days or one year. Garmy saves one note per day in Garmy/data. The sleep and recovery numbers land as properties:
---
steps: 10866
resting_hr: 49
stress: 32
body_battery: 84
sleep_score: 79
sleep_duration: "7h 5min"
hrv: 61
---
Example values. Garmy writes a property only when Garmin returns the number.
sleep_scoreGarmin's overall sleep score for the night.sleep_durationTime asleep as text, hours and minutes:7h 5min.hrvLast night's average HRV, in milliseconds.resting_hrResting heart rate of the day.body_batteryThe day's highest Body Battery value.stressThe day's average stress level. A day Garmin did not measure has nostressproperty.
3Choose Recovery
On the Choose step keep Everything, the first kind in the library. Under it are three groups: Recovery, Movement and Training. Keep Recovery and untick the other two if sleep and HRV are all you want. The groups show only while Everything is selected. The library also has Sleep and HRV and recovery kinds, each with its own layout; this guide follows Everything. Only metrics that exist in your data are used, so a watch that never recorded HRV gets no HRV card.
4The cards: how last night went
The first block is six cards with the latest value of each metric. Garmy writes this:
```stats
columns: 3
source: Garmy/data
items:
  - { label: Sleep, field: sleep_score, agg: latest, icon: 💤 }
  - { label: Sleep duration, field: sleep_duration, agg: latest, icon: 🛏 }
  - { label: HRV, field: hrv, agg: latest, unit: " ms", icon: 💓 }
  - { label: Body Battery, field: body_battery, agg: latest, icon: ⚡ }
  - { label: Resting HR, field: resting_hr, agg: latest, unit: " bpm", icon: ❤️ }
  - { label: Stress, field: stress, agg: latest, icon: 😰 }
```
agg: latestThe newest value in the folder.sourceThe data folder. Change it if you moved the day notes.unitAdded to HRV and resting heart rate:msandbpm.

5This week against your usual
Under the cards sit the 7 day averages, each against your usual level, with a small trend. Resting heart rate and stress count as better when they go down.
```stats
columns: 3
source: Garmy/data
period: 7d
items:
  - { label: Sleep, field: sleep_score, agg: avg, precision: 0, icon: 💤, compare: usual, better: up, trend: 14d }
  - { label: HRV, field: hrv, agg: avg, precision: 0, unit: " ms", icon: 💓, compare: usual, better: up, trend: 14d }
  - { label: Body Battery, field: body_battery, agg: avg, precision: 0, icon: ⚡, compare: usual, better: up, trend: 14d }
  - { label: Resting HR, field: resting_hr, agg: avg, precision: 0, unit: " bpm", icon: ❤️, compare: usual, better: down, trend: 14d }
  - { label: Stress, field: stress, agg: avg, precision: 0, icon: 😰, compare: usual, better: down, trend: 14d }
```
compare: usualThe change against the average of every day before the 7 day window. Needs 14 days of history; with fewer, Garmy writes plain 7 day averages.better: downResting heart rate and stress. Sleep, HRV and Body Battery arebetter: up.trend: 14dA small bar chart of the last 14 days under the number.
6Sleep and HRV over time
Two line charts follow: sleep score with Body Battery, and HRV with resting heart rate. They appear once you have 7 days of data.
```dashy-chart
source: Garmy/data
range: 90d
agg: avg
title: Sleep / Body Battery
series:
  - { field: sleep_score, label: Sleep, color: purple }
  - { field: body_battery, label: Body Battery, color: cyan }
```

```dashy-chart
source: Garmy/data
range: 90d
agg: avg
title: HRV / Resting HR
series:
  - { field: hrv, label: HRV, color: green }
  - { field: resting_hr, label: Resting HR, color: red }
```
range: 90dThe longest window of 7, 14, 30, 60 or 90 days that fits your history.dashy-chartThe block language isdashy-chart, becausechartbelongs to the Obsidian Charts plugin.seriesTwo lines per chart with colours from Garmy's palette. Editcolororlabelfreely.
These blocks work in any note, not only the dashboard. Copy one to your home page and keep source: Garmy/data pointing at the day notes.
Keep it current
Garmy syncs shortly after Obsidian starts and then every 6, 12 or 24 hours (your choice, or off). The three latest days are rewritten on each sync, so last night's score is corrected if Garmin revises it. After a month, run Garmy: Rebuild the dashboard in this note to get the charts and comparisons that a week of data could not support.
If a card is missing
- No sleep cards. Garmy writes sleep properties for a night only when Garmin returns a score or a duration. No nights in the period, no cards.
- No HRV. Same rule:
hrvcomes from Garmin's last night average. - No Training Readiness card. Garmin's Personal API does not provide it.
Related guides
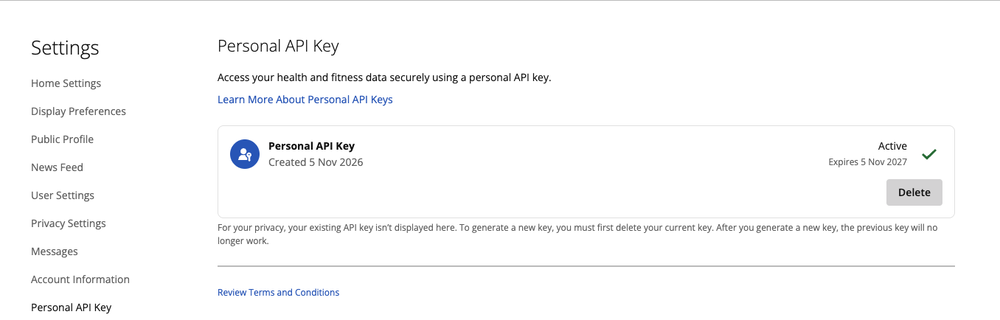
Where to find the key in Garmin Connect, how long it lasts, which numbers Garmy reads with it and which Garmin does not provide.

Run, bike, swim and strength per week, a month calendar, a year map by sport and monthly goals, built from your Garmin activities.
Two ways to get Garmin numbers into Obsidian notes. What Garmy does, what it leaves out, and how it works with notes Health Sync already wrote.
Garmy is in Obsidian's community plugins. Install it, then Dashy, and run the wizard.