A steps dashboard in Obsidian: streaks, a monthly goal and a year map
stepsHow many steps you take on an average day, how long you have been over 10,000 in a row, how this month compares with the last, and a map of the whole year. All from the one number Garmy writes into your daily notes.
1The average day and the streaks
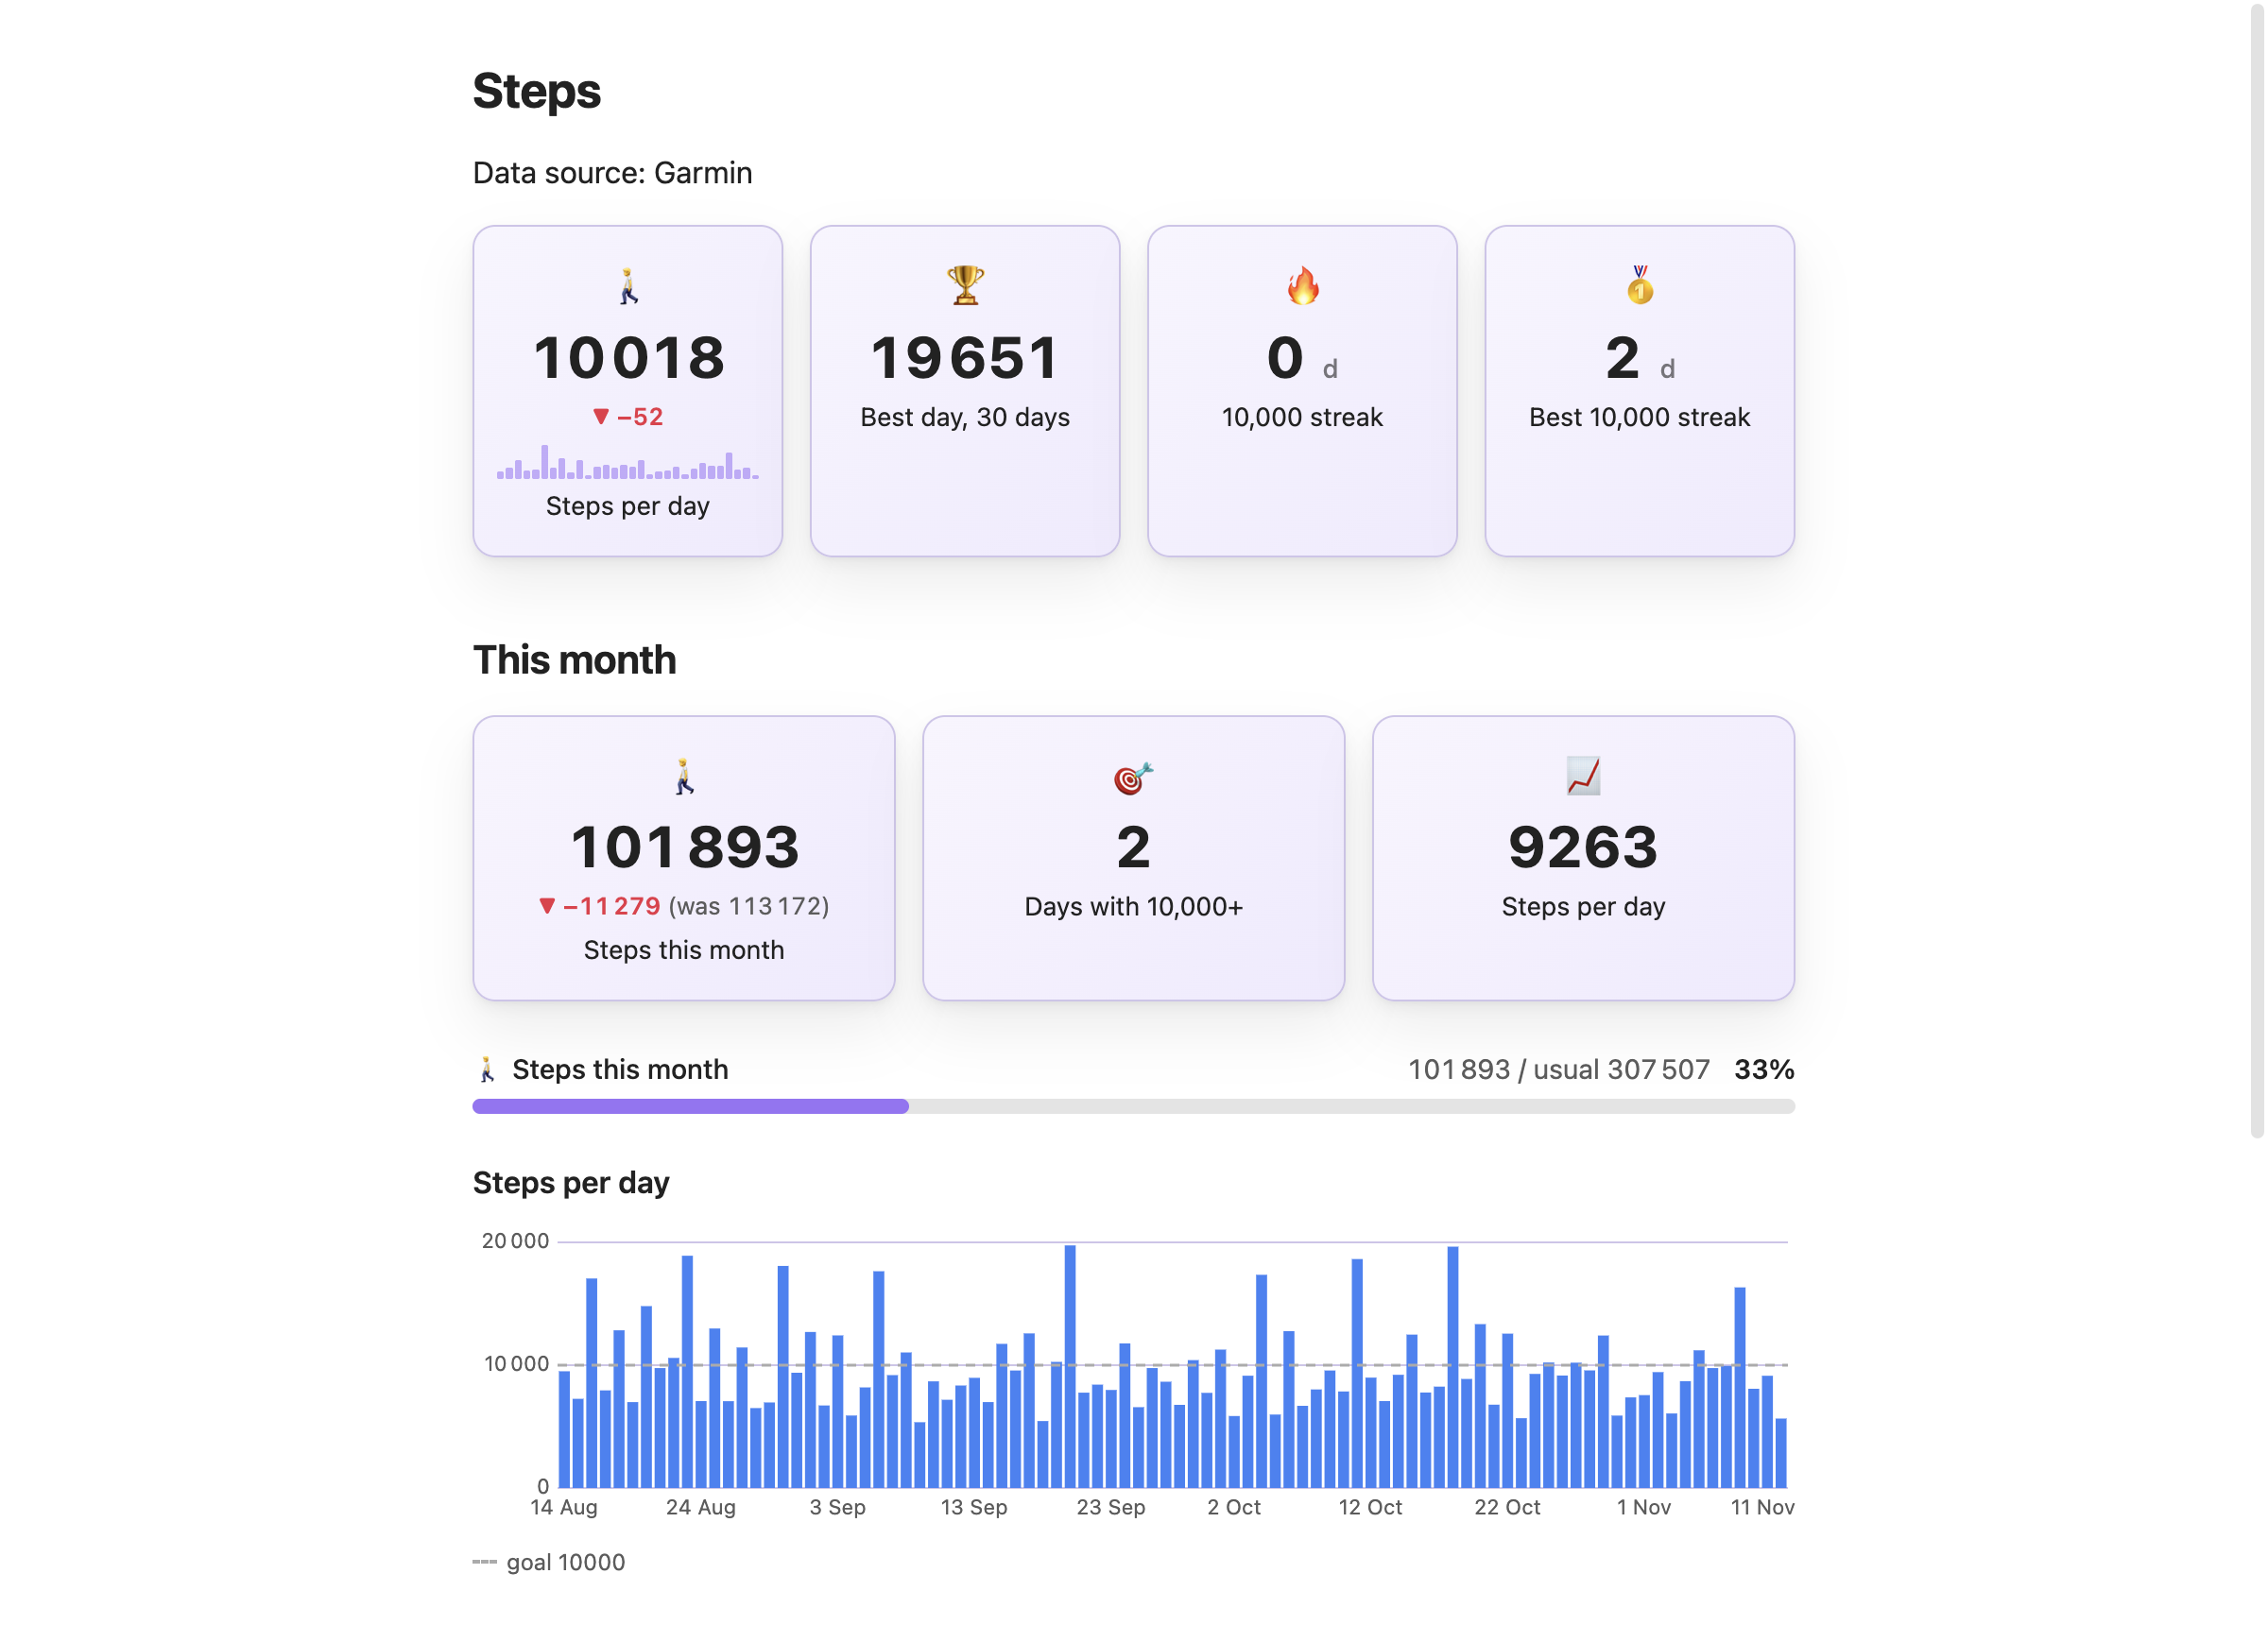
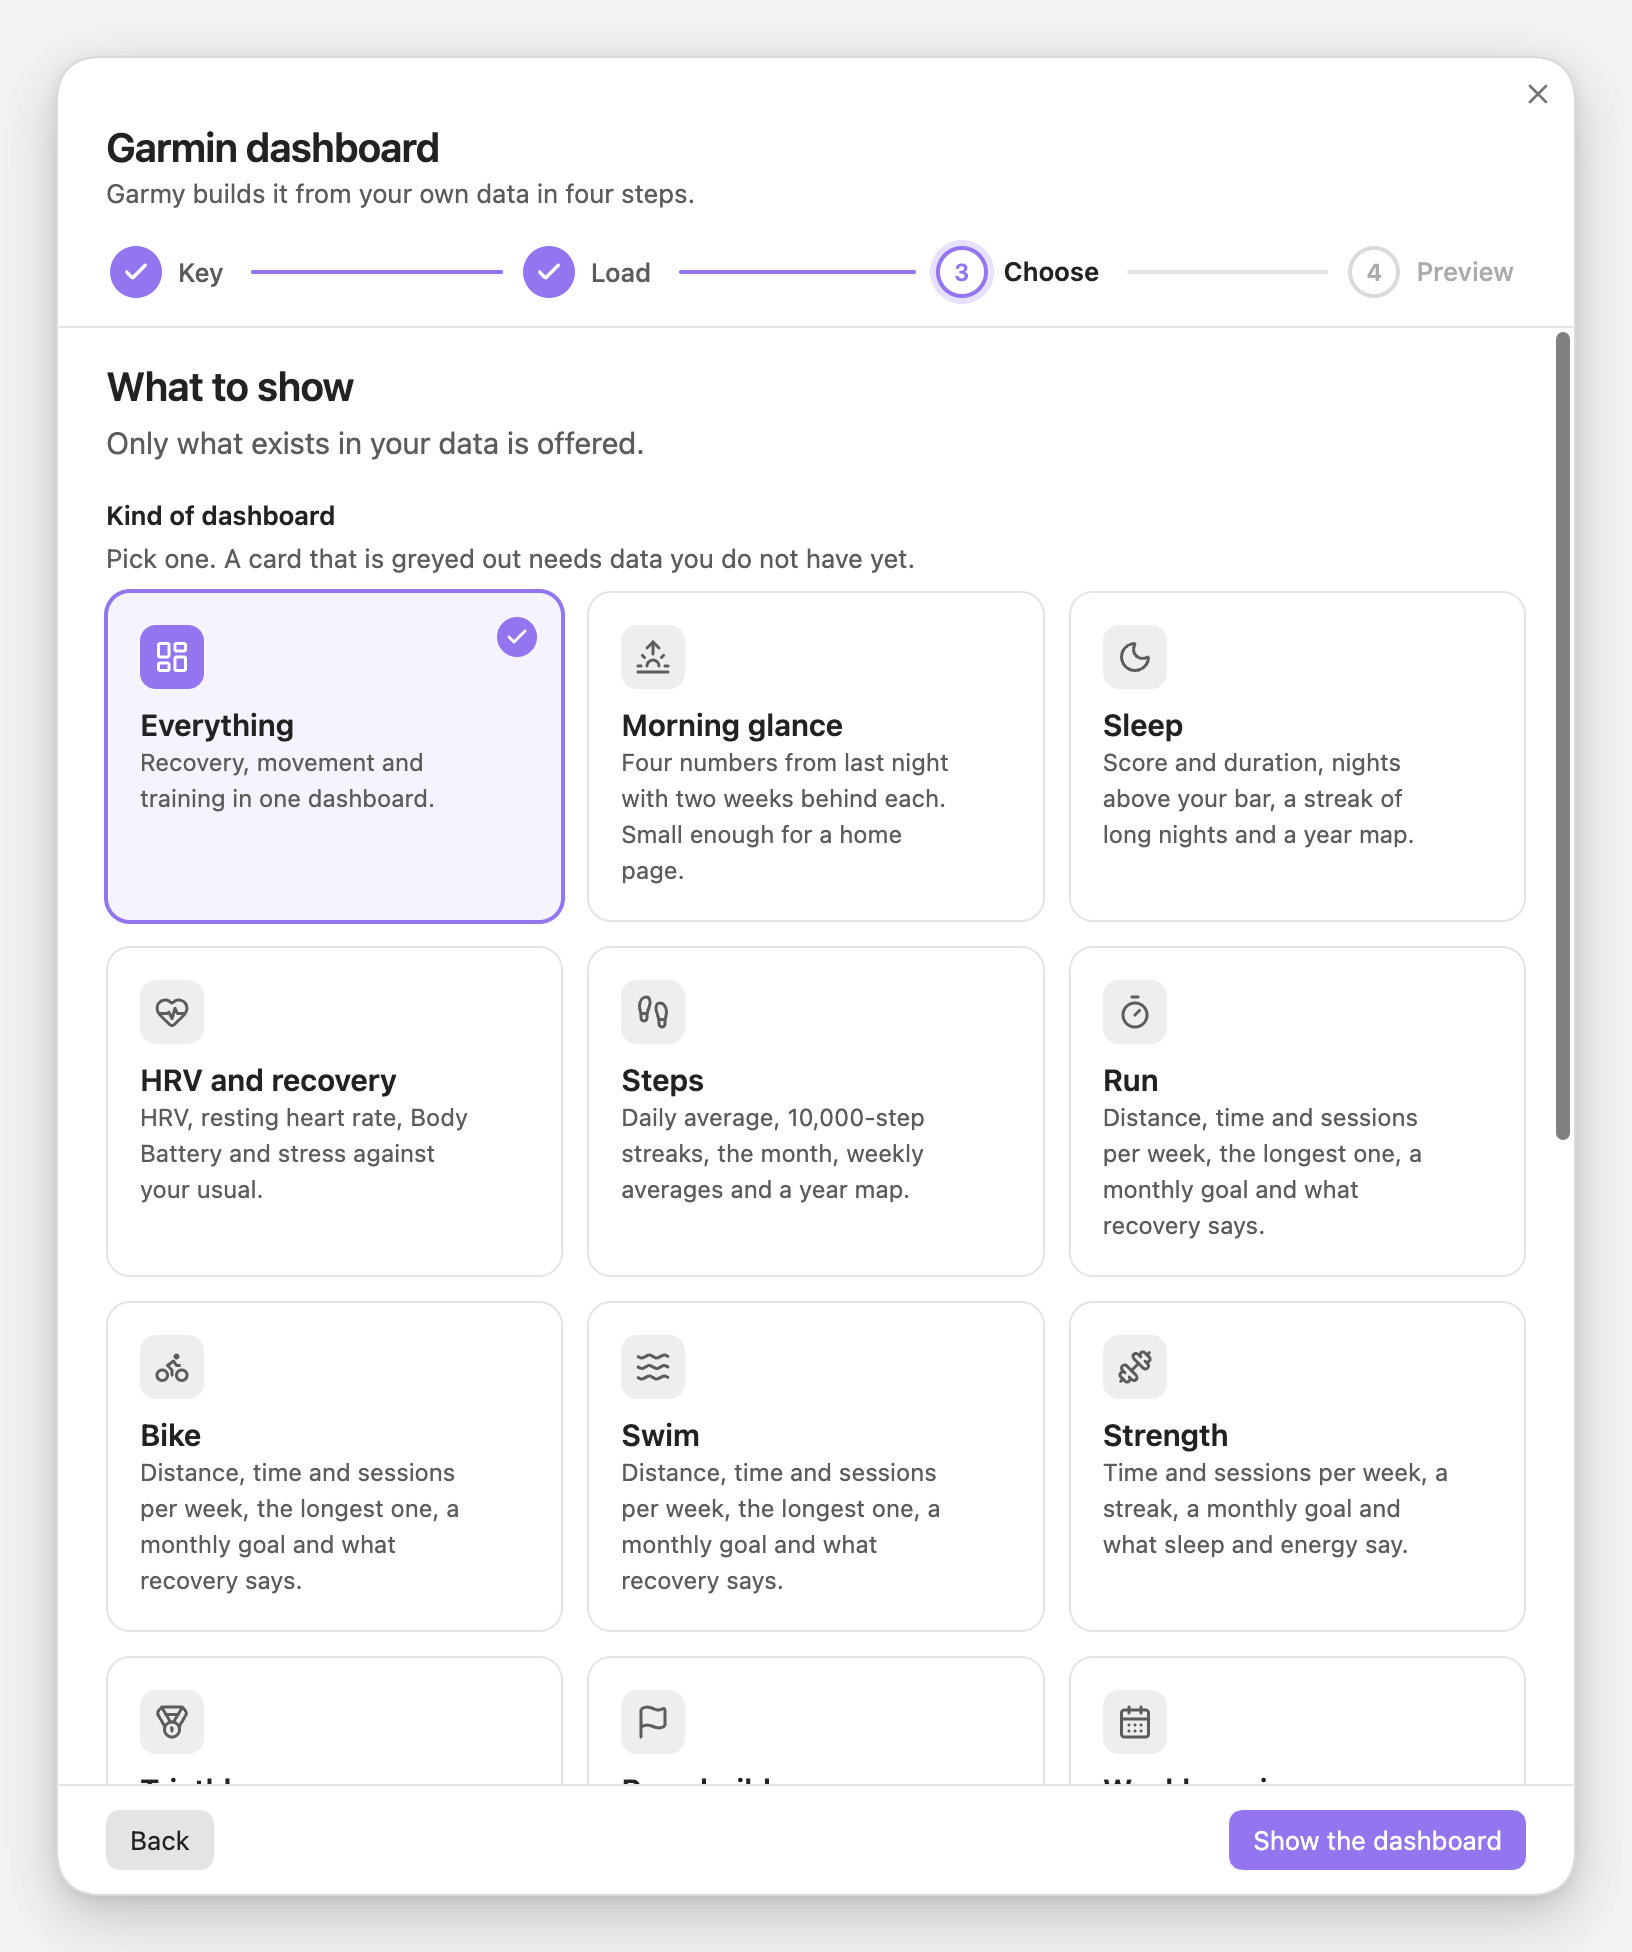
Garmy writes steps into every day note. Pick Steps in the wizard. The first row is four cards: your average day over the last 7 days against your usual, the best day of the last 30, the 10,000 step streak you are on and the best one on record.
```stats
columns: 4
source: Garmy/data
items:
  - { label: Steps per day, field: steps, agg: avg, period: 7d, precision: 0, icon: 🚶, compare: usual, better: up, trend: 30d }
  - { label: "Best day, 30 days", field: steps, agg: max, period: 30d, icon: 🏆 }
  - { label: "10,000 streak", field: steps, agg: current_streak, at_least: 10000, unit: " d", icon: 🔥 }
  - { label: "Best 10,000 streak", field: steps, agg: streak, at_least: 10000, unit: " d", icon: 🥇 }
```
agg: current_streakThe run going on now. Today never breaks it: a day not finished yet leaves the run counted up to yesterday.agg: streakThe longest run on record. Label it that way, it is not the current one.at_least: 10000A day counts only from 10,000 steps up.compare: usualNeedsagg: avg. The average of every earlier day is the usual level.
2This month
Steps this month against the same stretch of last month, the days over 10,000 and the average day.
```stats
columns: 3
source: Garmy/data
period: month
items:
  - { label: Steps this month, field: steps, agg: sum, icon: 🚶, compare: true, better: up }
  - { label: "Days with 10,000+", agg: count, where: "steps >= 10000", icon: 🎯 }
  - { label: Steps per day, field: steps, agg: avg, precision: 0, icon: 📈 }
```
agg: countCounts days.where: "steps >= 10000"keeps only the days that reached it.period: monthThe current calendar month, written once on the block.
3A goal for the month
The goal is your last 28 days plus a tenth, rounded up to a number a person would pick. It is a bar, not a target someone else chose.
```progress
source: Garmy/data
period: month
items:
  - { label: Steps this month, field: steps, agg: sum, goal: 250000, icon: 🚶 }
```4Daily and weekly bars
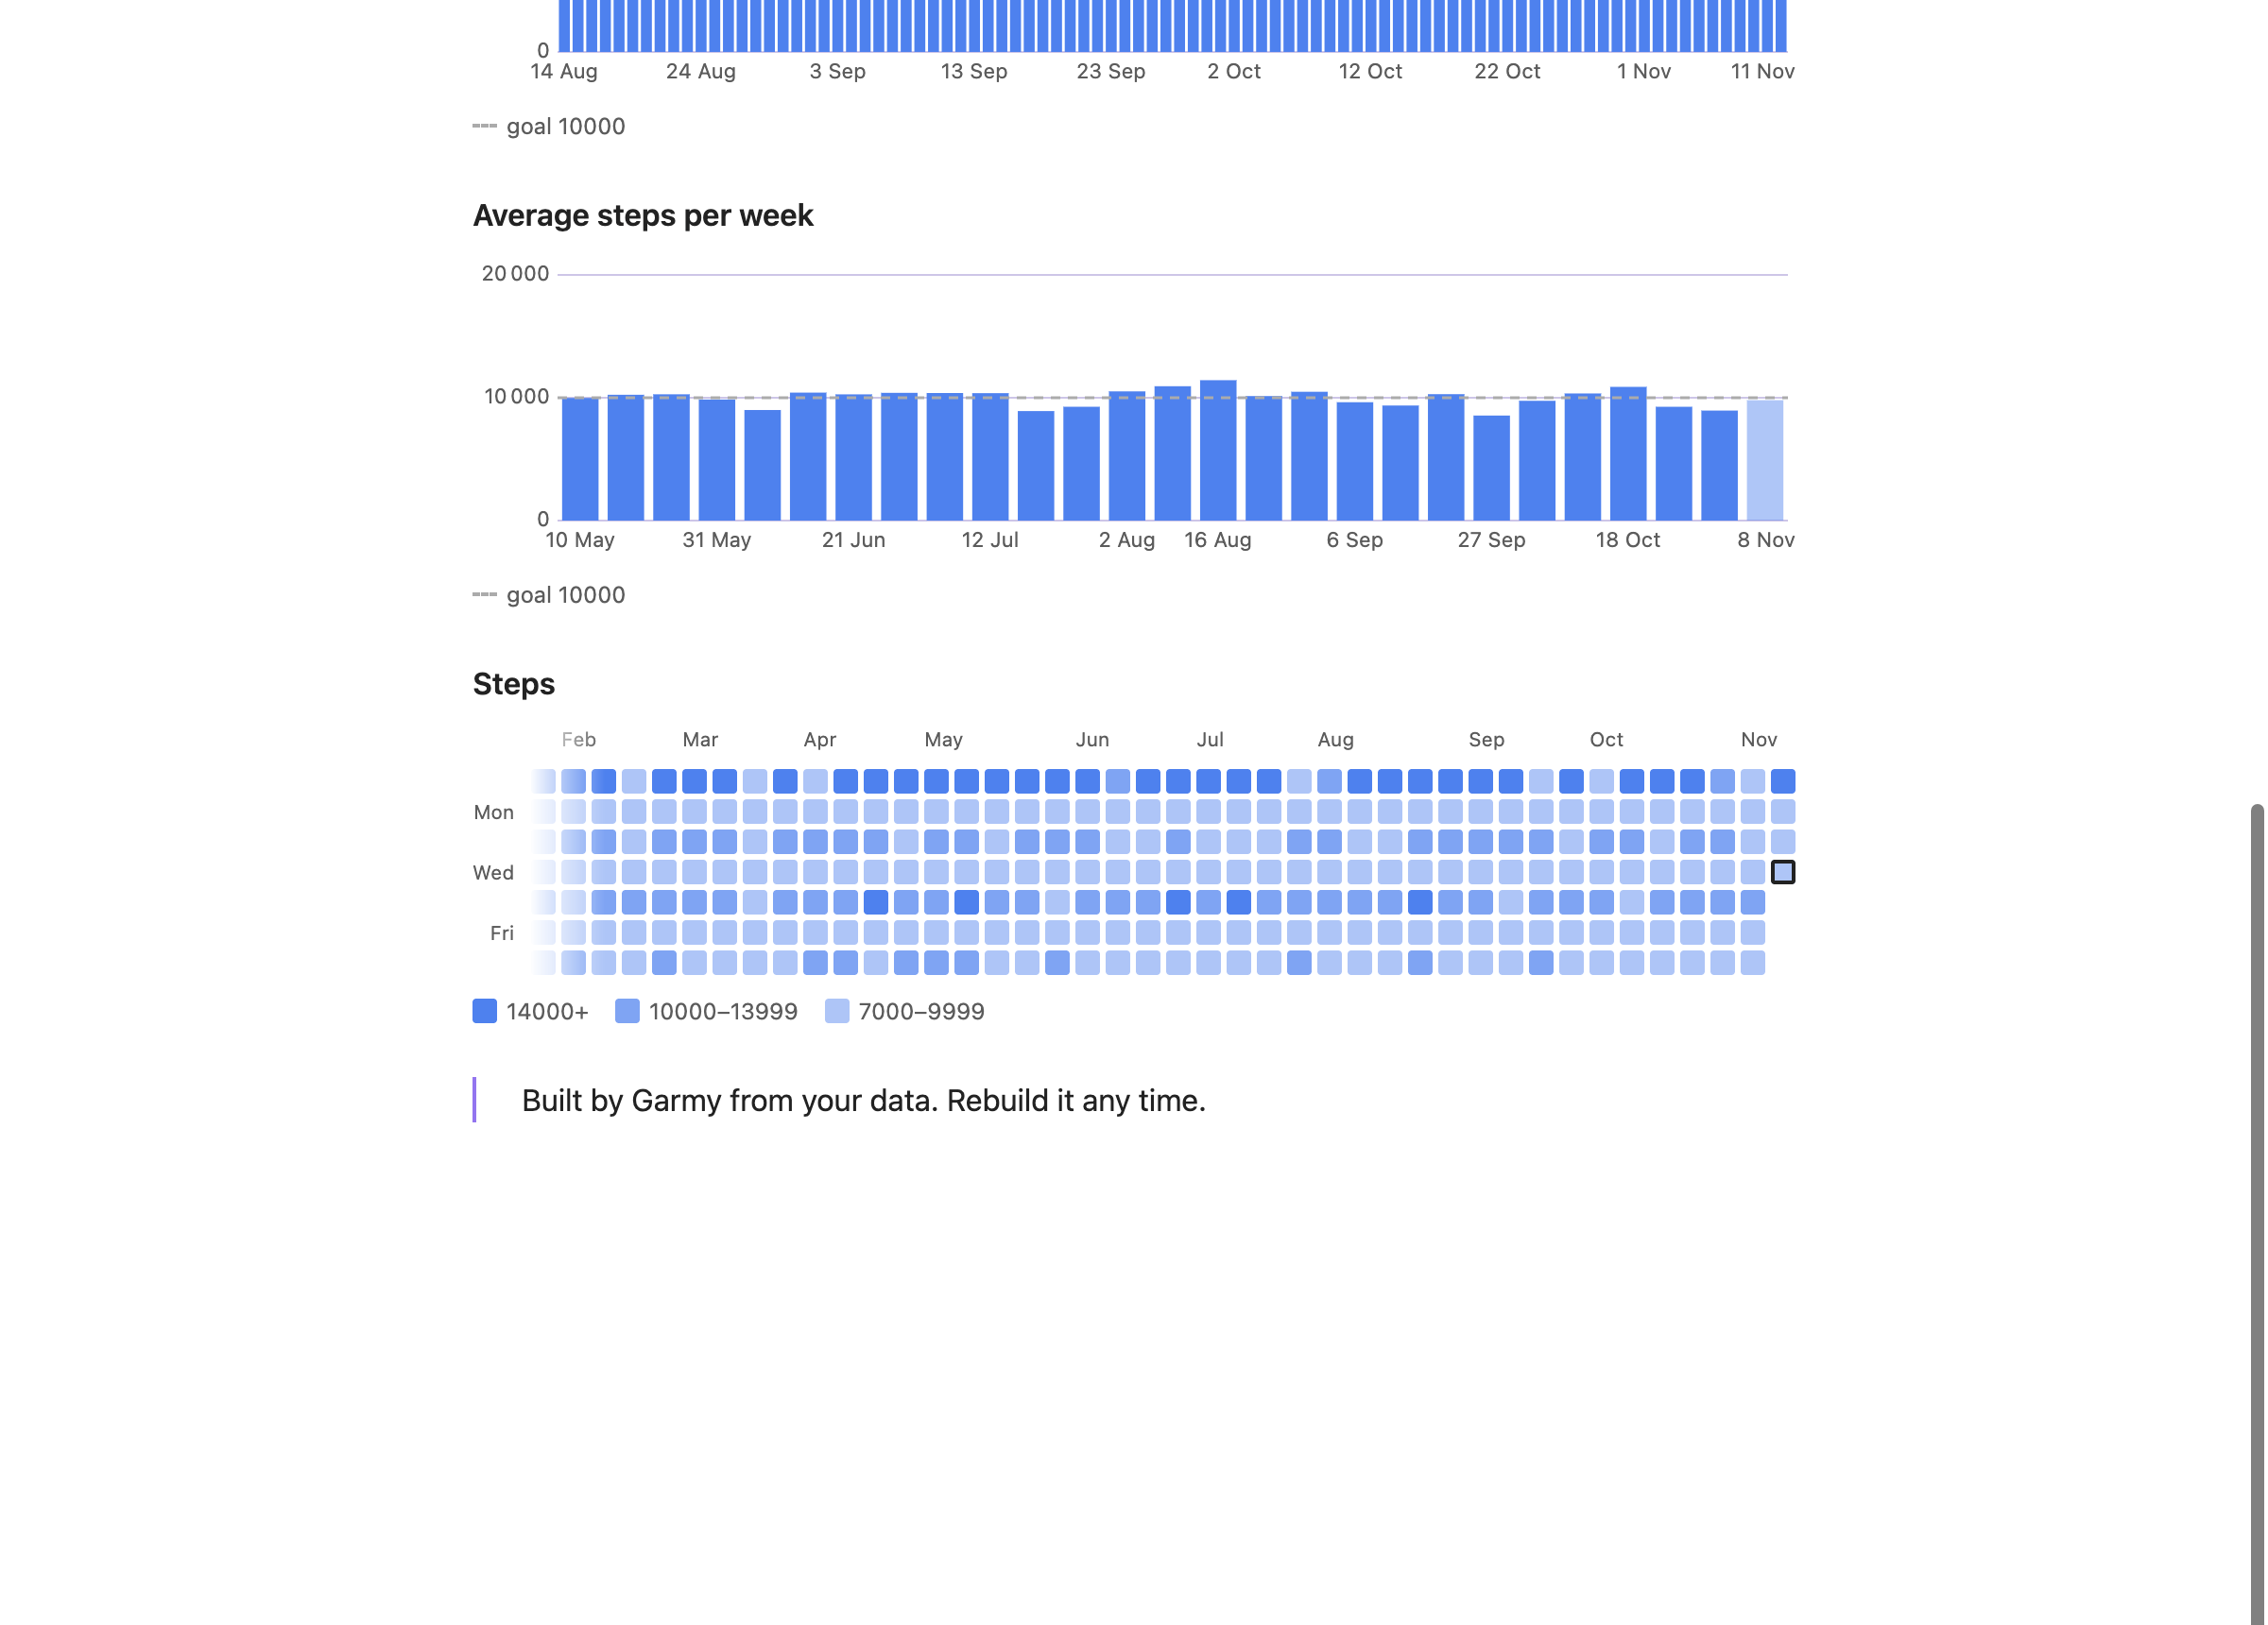
Steps per day as bars with a dashed line at 10,000. With 28 days of data a second chart averages the days of each week.
```dashy-chart
source: Garmy/data
field: steps
type: bar
range: 90d
goal: 10000
label: Steps
title: Steps per day
``````dashy-chart
source: Garmy/data
field: steps
type: bar
agg: avg
bucket: week
range: 119d
goal: 10000
label: Steps
title: Average steps per week
```goal: 10000A dashed reference line. The y axis always stretches to show it.agg: avgWithbucket: week, the average steps of a day in each week.
5A year map
One cell per day for the last 365 days, shaded in bands from 7,000 to 14,000 steps. It appears once you have 30 days of data.
```heatmap
source: Garmy/data
field: steps
color: blue
range: 365d
bands: [14000, 10000, 7000]
title: Steps
```
Change the numbers in bands to fit your own days. Thresholds go from the top down.
Related guides
Sleep, HRV, steps, one page per sport, triathlon, race build, weekly and monthly reviews: what each shows and what it needs.
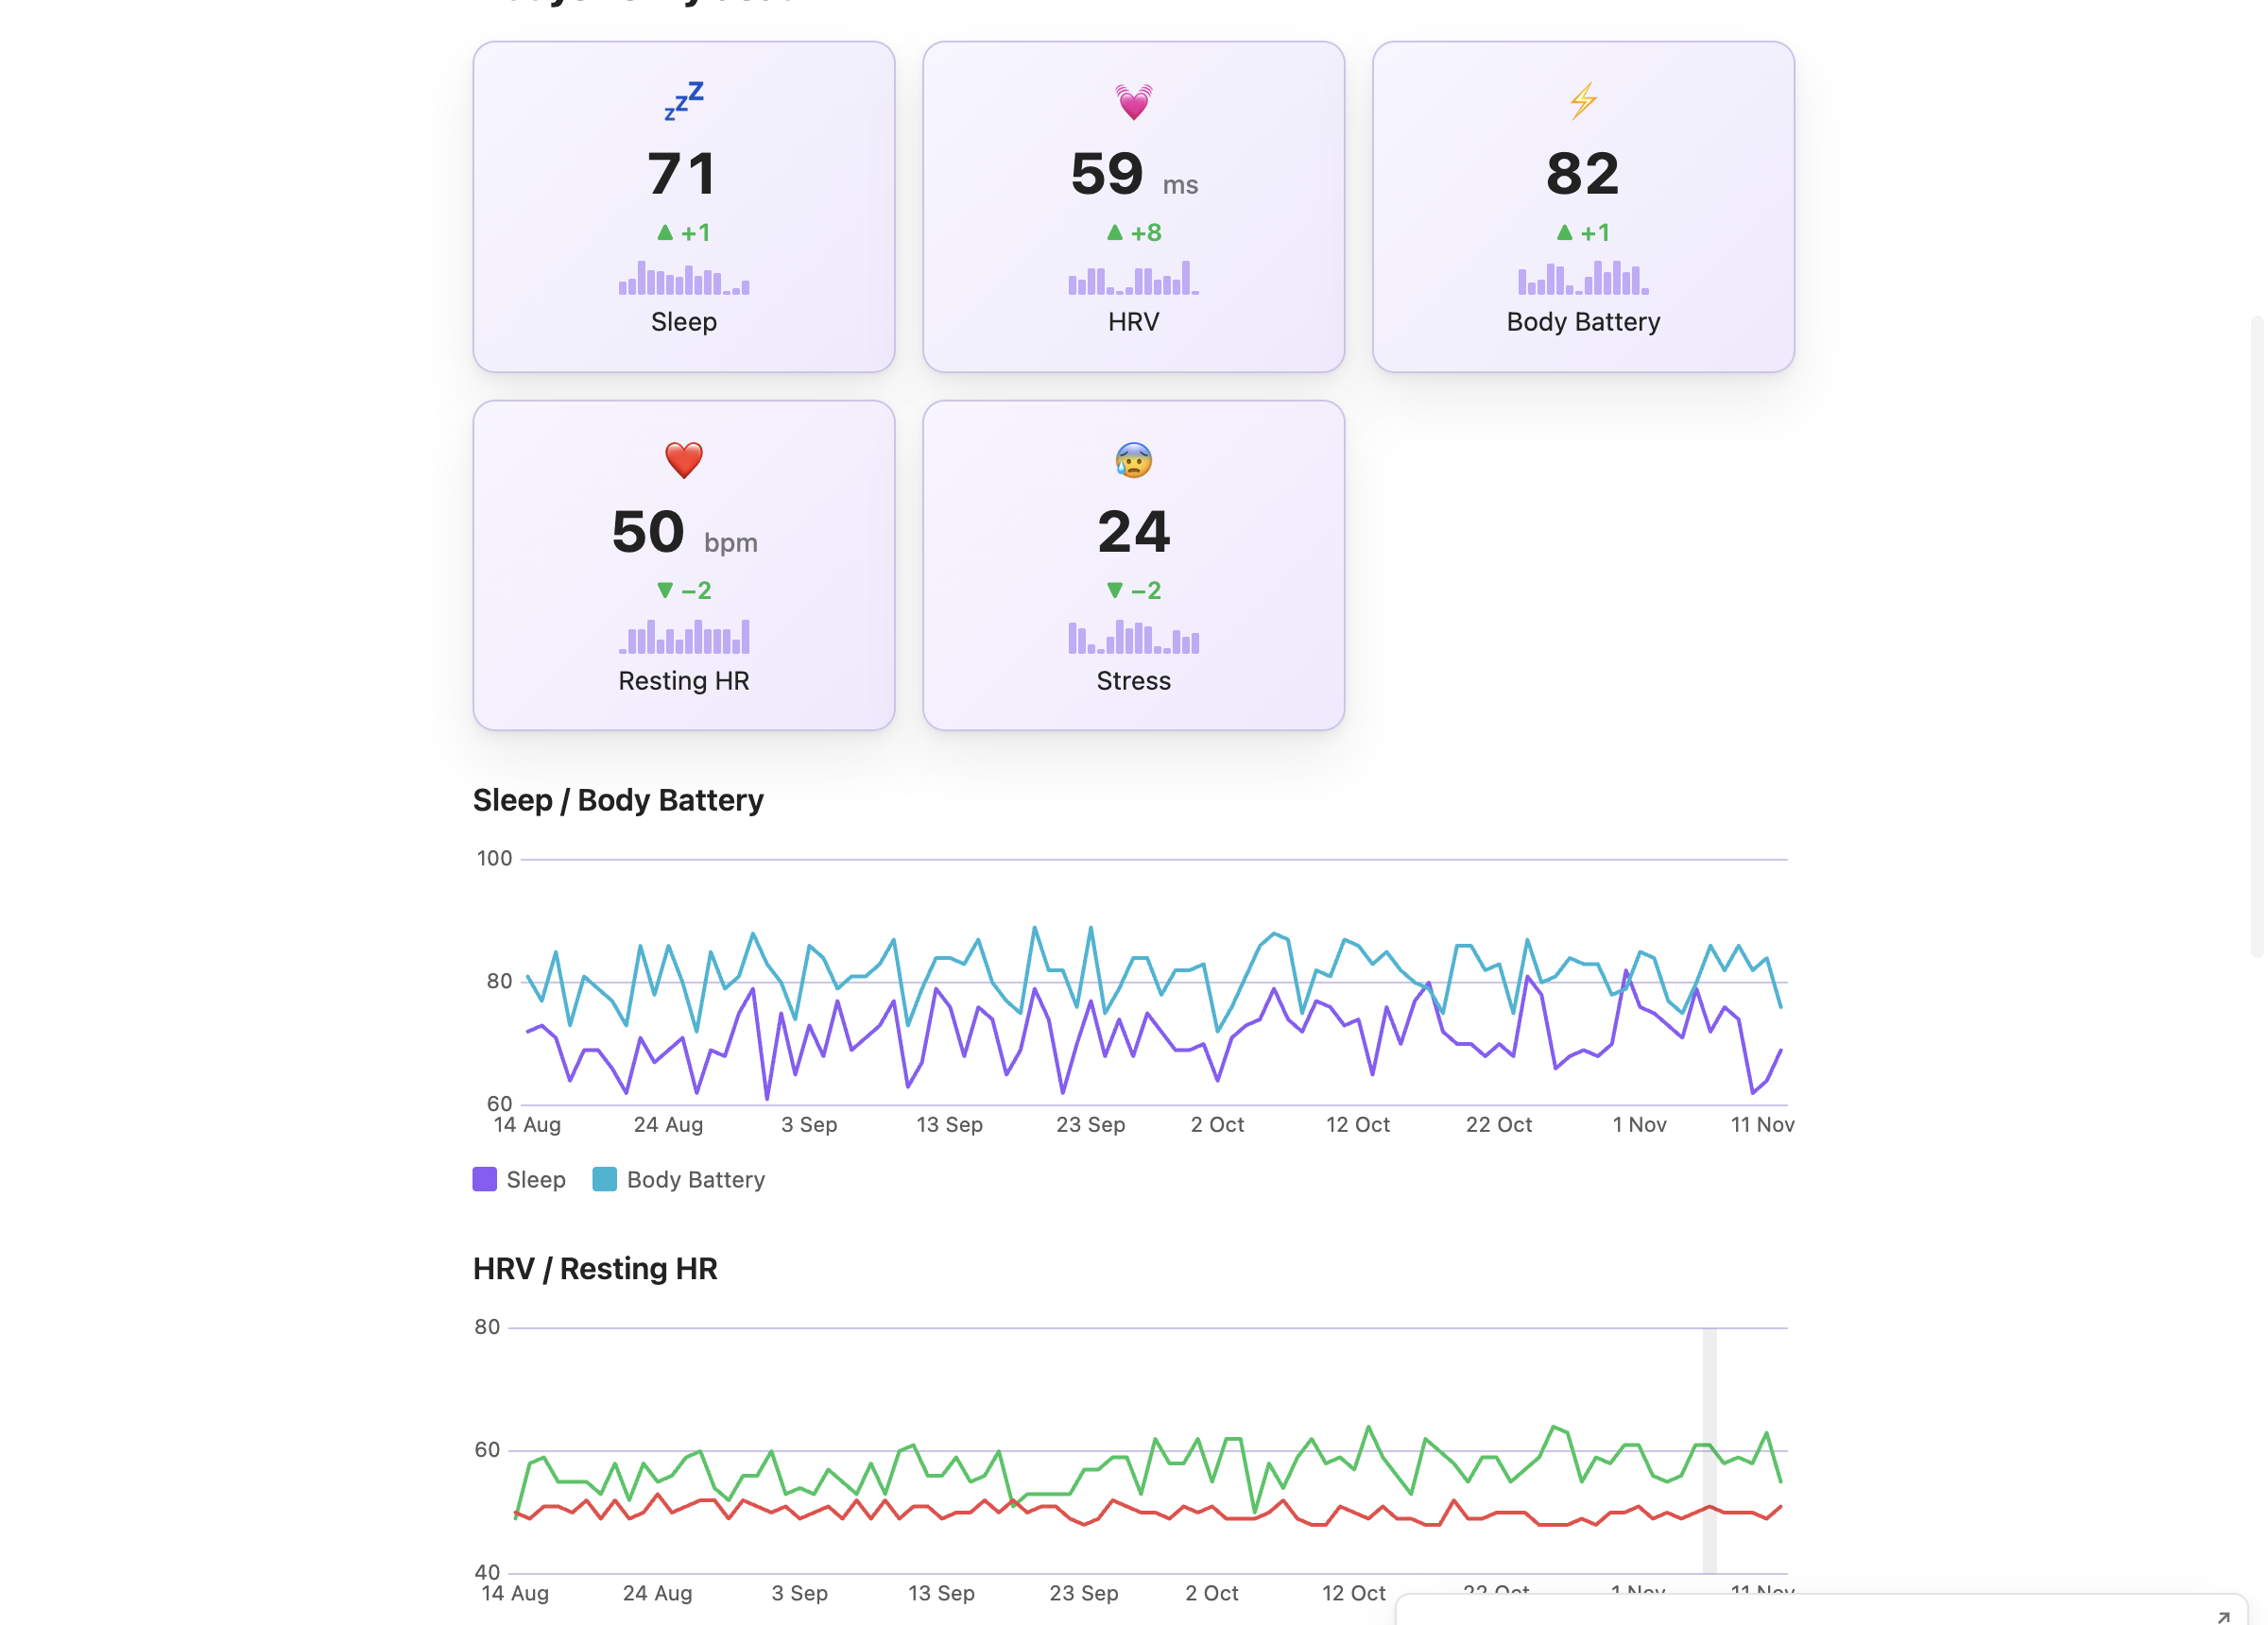
Sleep score, sleep duration, HRV, resting heart rate and Body Battery as cards and charts in one note.
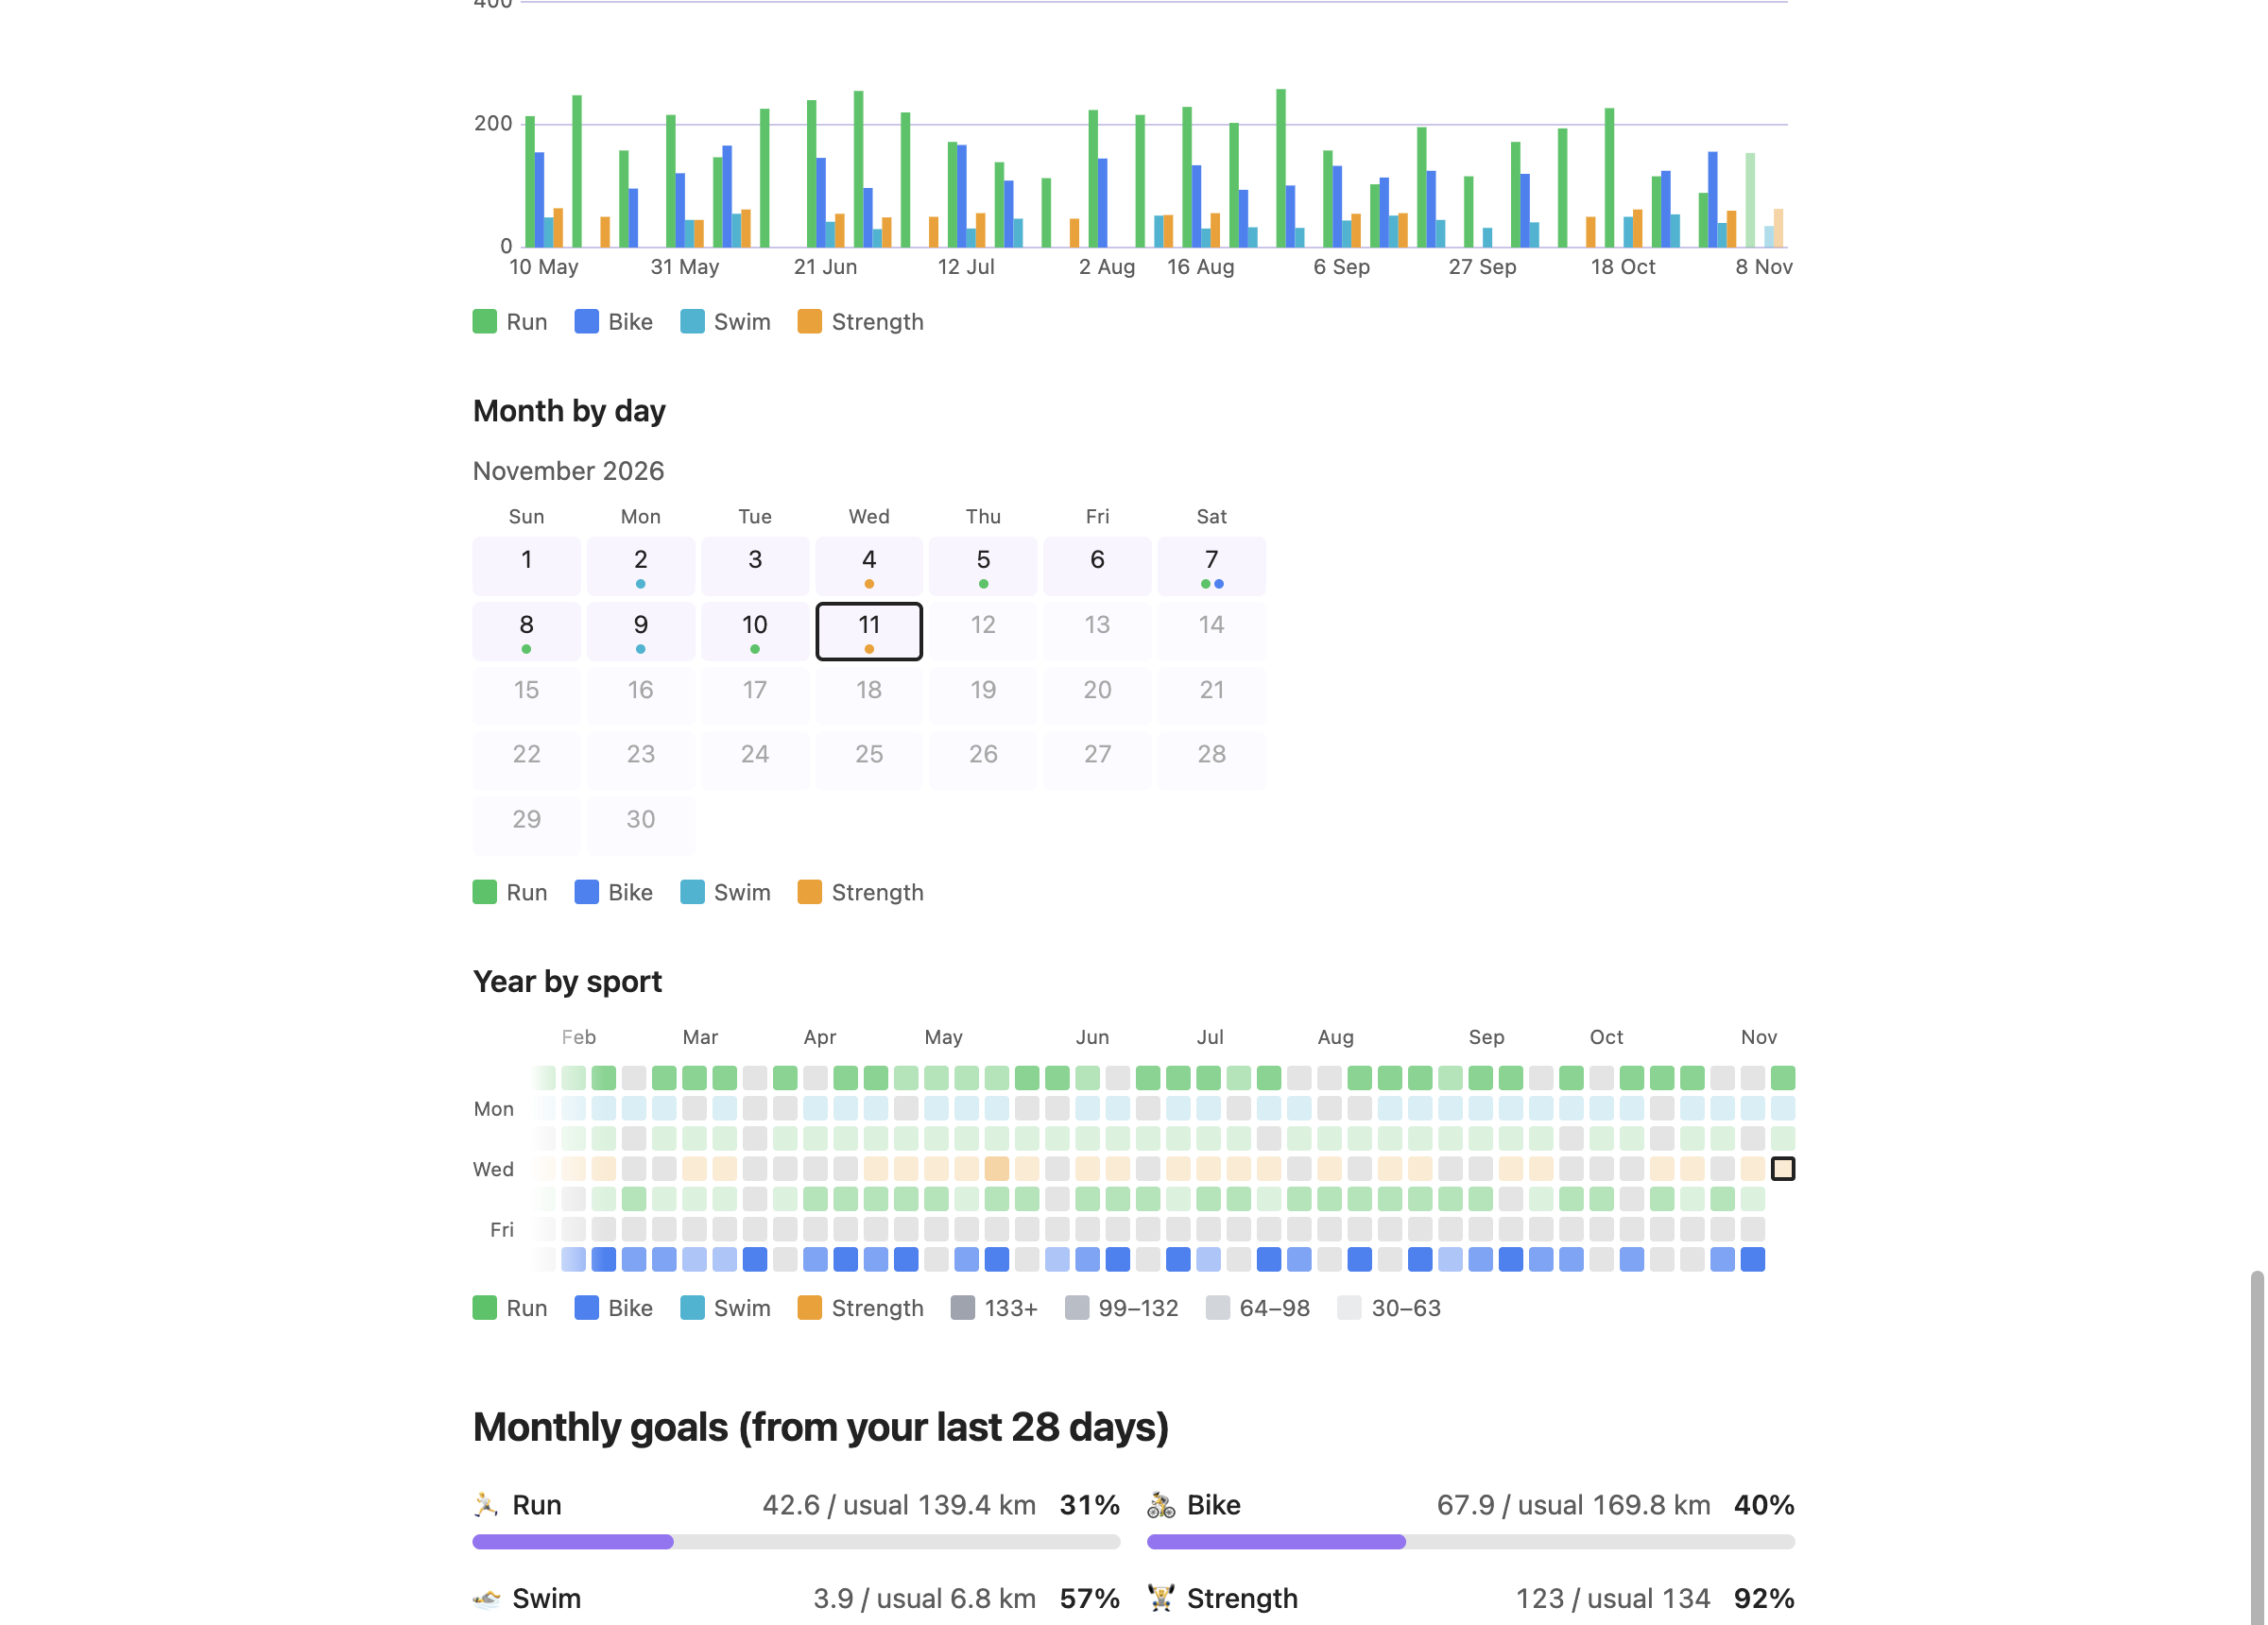
Run, bike, swim and strength per week, a month calendar, a year map by sport and monthly goals.
Install Garmy and Dashy, load your history and pick Steps in the third step.