A race countdown and build-up in Obsidian from Garmin
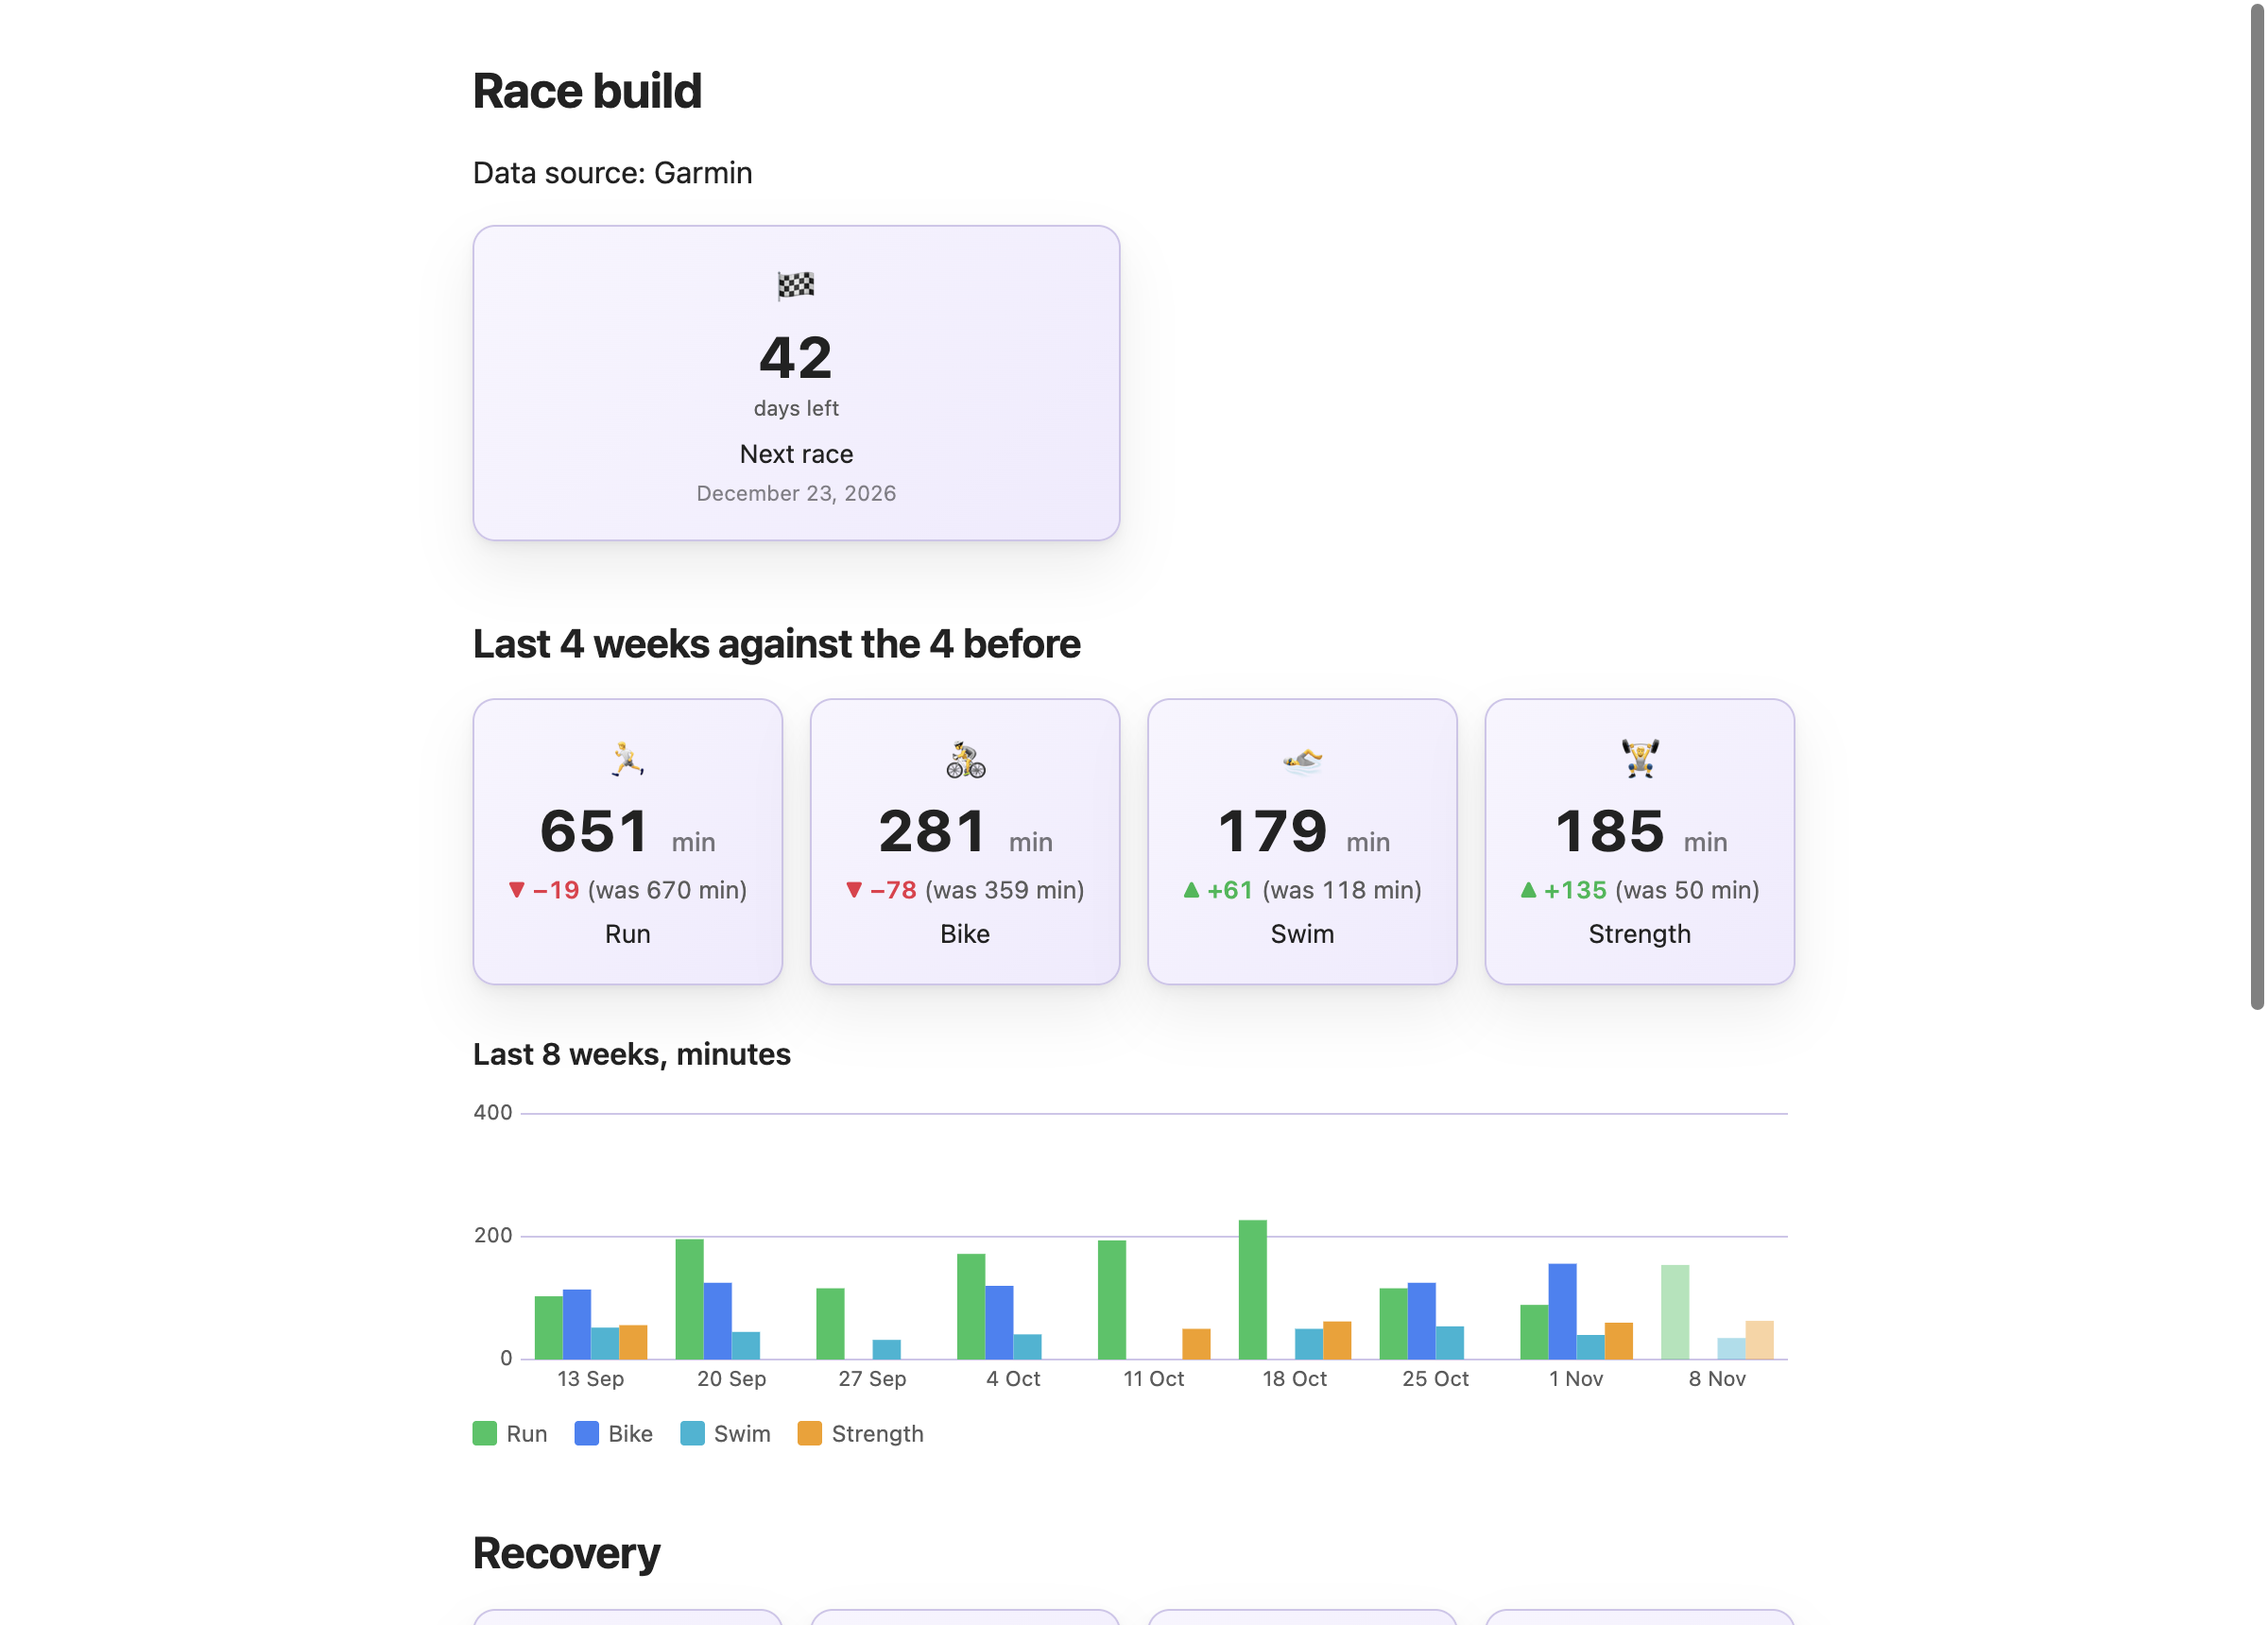
date run_min bike_min swim_min hrv resting_hrDays to the start, what the last four weeks added up to against the four before, and how your recovery signals are holding. The Race build dashboard needs one date or one folder of race notes and writes the rest from your Garmin data.
1Give Garmy a date, or a folder of races
The wizard has a field under Options: Race date or races folder. The Race build card is greyed out until it holds something. A single date is the quickest:
```countdown
columns: 2
items:
  - { label: Next race, date: 2026-12-06, icon: 🏁 }
```
If you keep one note per race, with a date property each, give Garmy the folder instead. The countdown then points at the next race still ahead and shows that note's name.
---
date: 2026-12-06
---```countdown
columns: 2
items:
- { label: Next race, field: date, source: Races, pick: next, icon: 🏁 }
```dateOne day, written as YYYY-MM-DD.pick: nextReads every note in the folder and counts to the soonest date from today on. A race that has passed is skipped.
2Four weeks against the four before
One card per sport, in minutes, over the last 28 days. Each is compared with the 28 days before, so a build that has gone quiet shows up in red.
```stats
columns: 4
source: Garmy/data
period: 28d
items:
  - { label: Run, field: run_min, agg: sum, unit: " min", icon: 🏃, compare: true, better: up }
  - { label: Bike, field: bike_min, agg: sum, unit: " min", icon: 🚴, compare: true, better: up }
  - { label: Swim, field: swim_min, agg: sum, unit: " min", icon: 🏊, compare: true, better: up }
  - { label: Strength, field: strength_min, agg: sum, unit: " min", icon: 🏋️, compare: true, better: up }
```
period: 28dA rolling window ending today.compare: trueThe change against the same stretch of the previous period.unit: minMinutes, not distance, so a swim and a ride sit on one scale.
3Eight weeks of bars
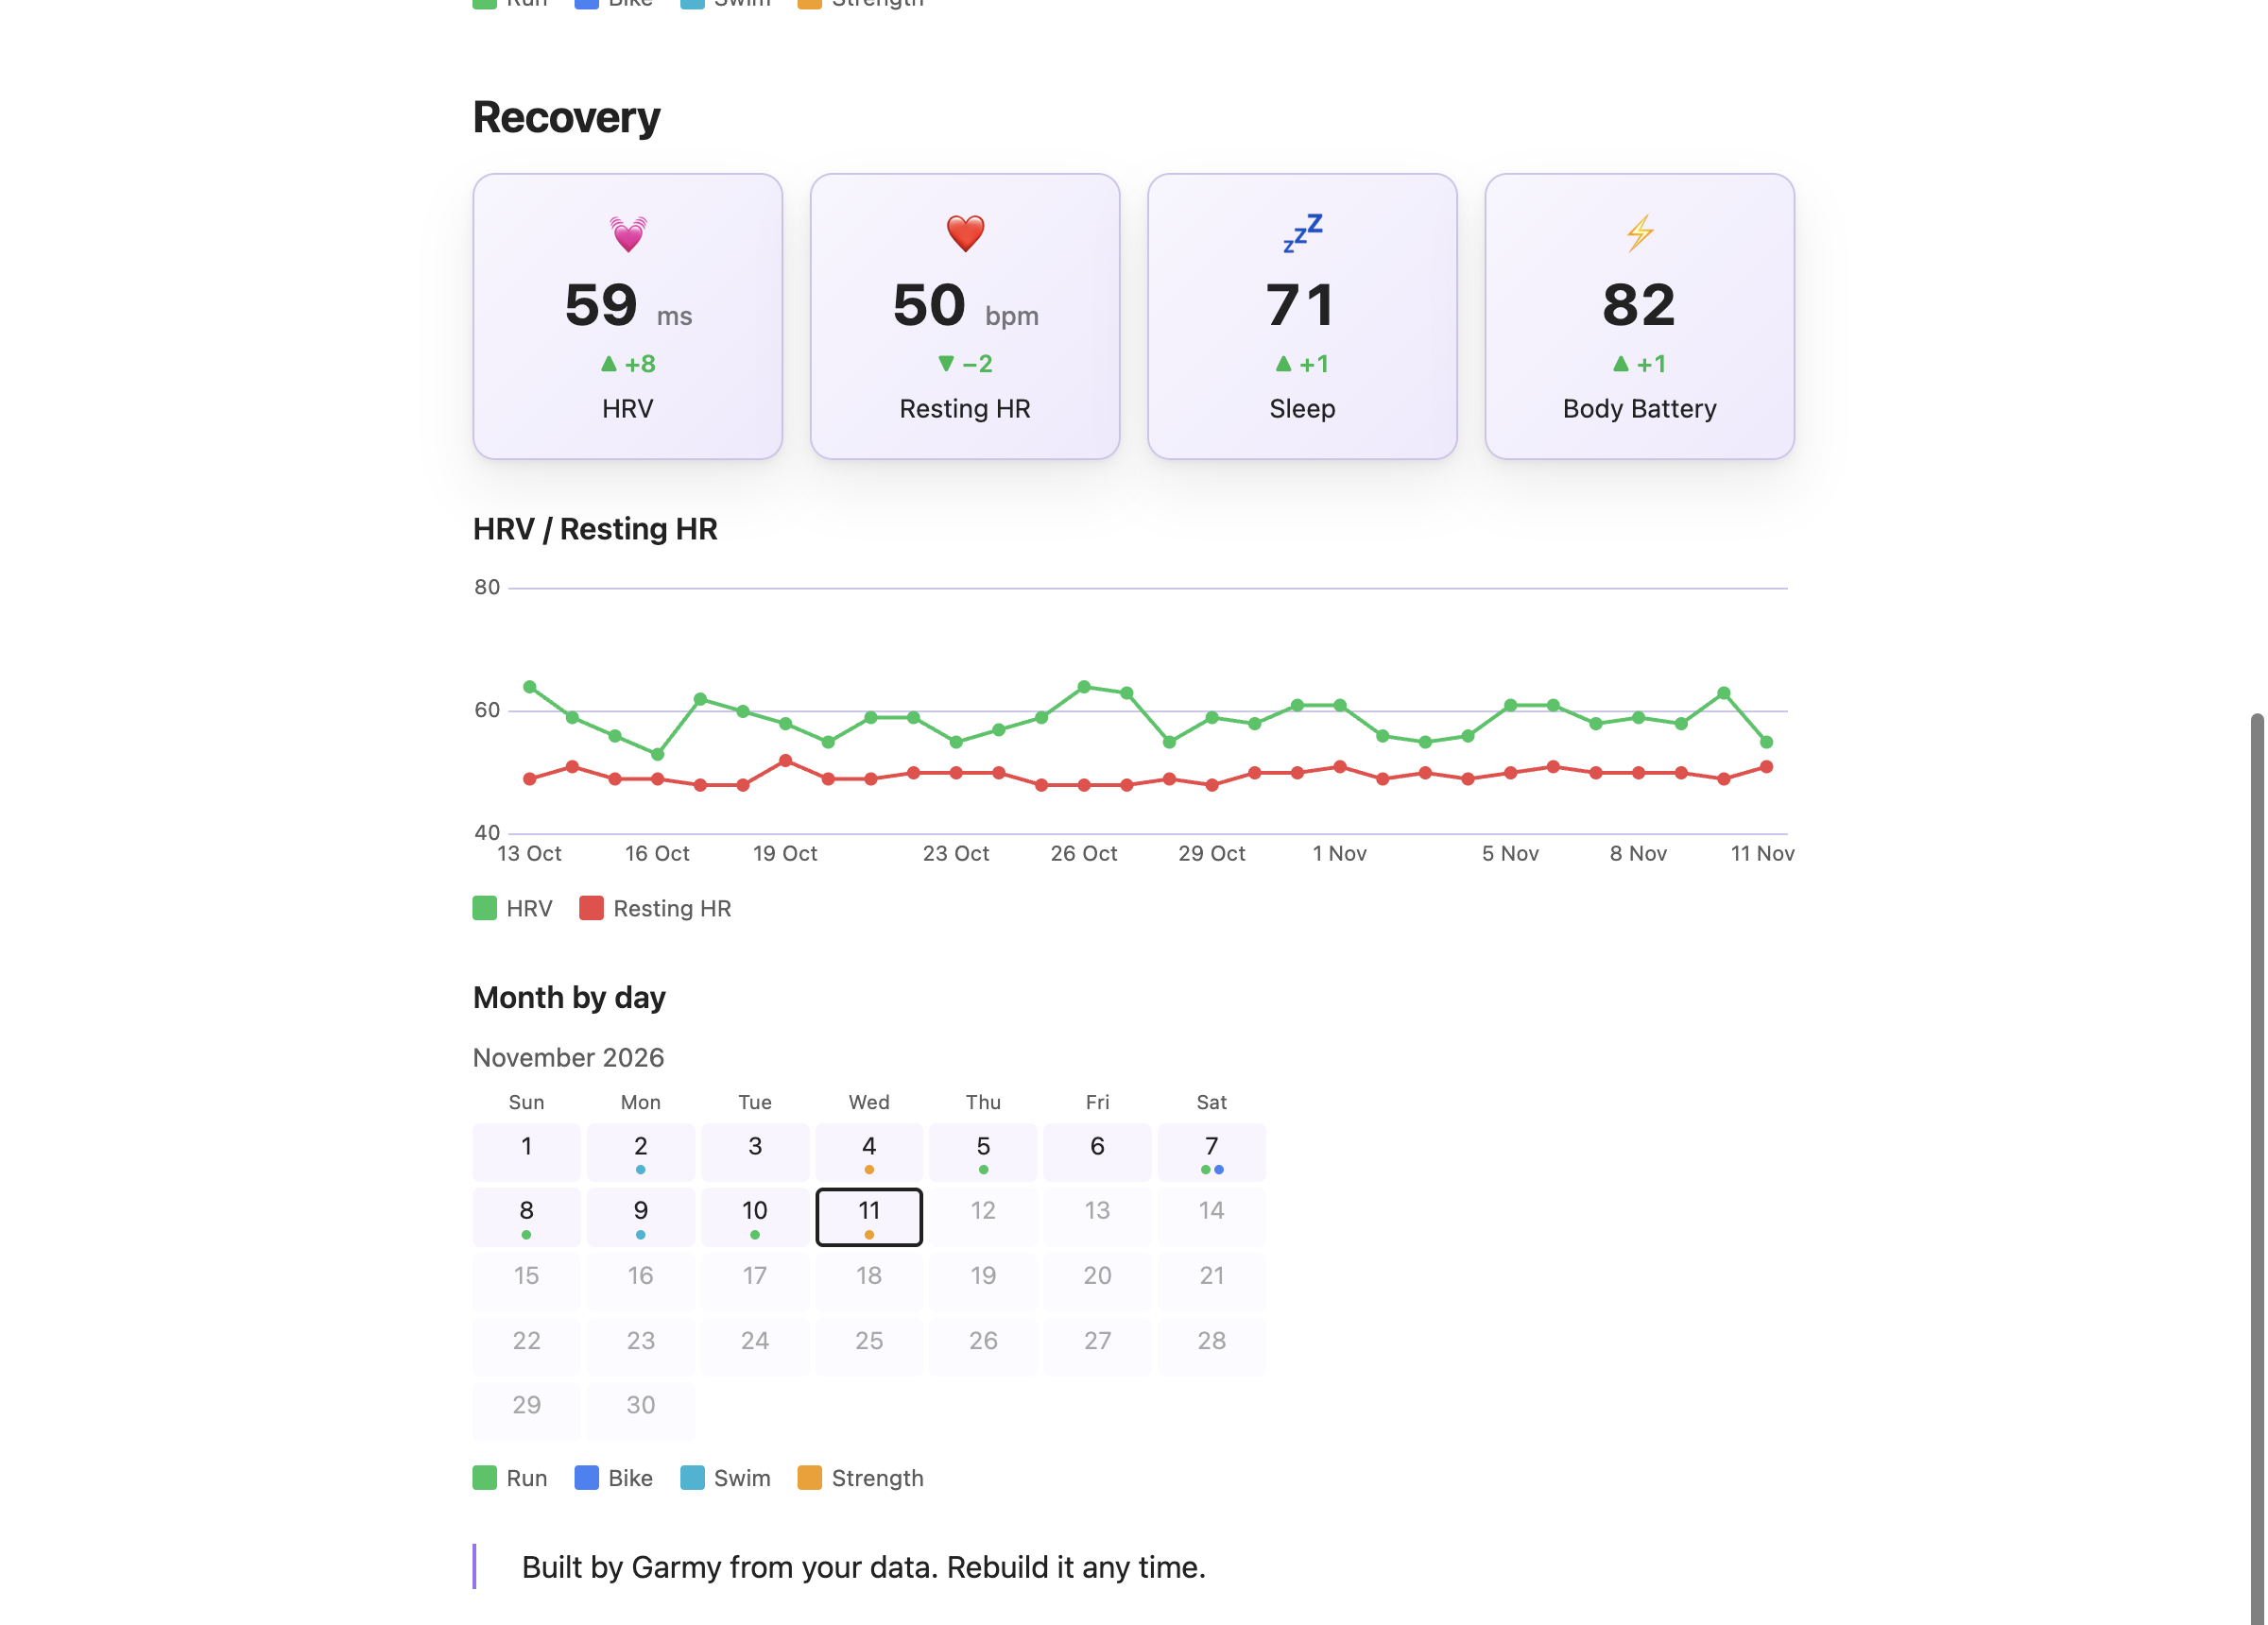
The same minutes as weekly bars per sport, for the last eight weeks.
```dashy-chart
source: Garmy/data
type: bar
bucket: week
range: 56d
agg: sum
title: "Last 8 weeks, minutes"
series:
  - { field: run_min, label: Run, color: green }
  - { field: bike_min, label: Bike, color: blue }
  - { field: swim_min, label: Swim, color: cyan }
  - { field: strength_min, label: Strength, color: orange }
```
4How the body takes it
Sleep score, HRV, resting heart rate and Body Battery over the last 7 days, each against your usual level, then HRV with resting heart rate over the last 30 days. A rising resting heart rate with a falling HRV during a heavy block is what you are looking for.
```stats
columns: 4
source: Garmy/data
period: 7d
items:
  - { label: HRV, field: hrv, agg: avg, precision: 0, unit: " ms", icon: 💓, compare: usual, better: up }
  - { label: Resting HR, field: resting_hr, agg: avg, precision: 0, unit: " bpm", icon: ❤️, compare: usual, better: down }
  - { label: Sleep, field: sleep_score, agg: avg, precision: 0, icon: 💤, compare: usual, better: up }
  - { label: Body Battery, field: body_battery, agg: avg, precision: 0, icon: ⚡, compare: usual, better: up }
``````dashy-chart
source: Garmy/data
range: 30d
agg: avg
title: HRV / Resting HR
series:
- { field: hrv, label: HRV, color: green }
- { field: resting_hr, label: Resting HR, color: red }
```This is a picture of your own numbers. It does not tell you what to do about them.
5After the race
The countdown counts up after the date, so the card still says how long ago the race was. Change the date in the options and rebuild the dashboard for the next one. The kind is stored in the note, so Rebuild the dashboard in this note keeps it a race build.
Related guides
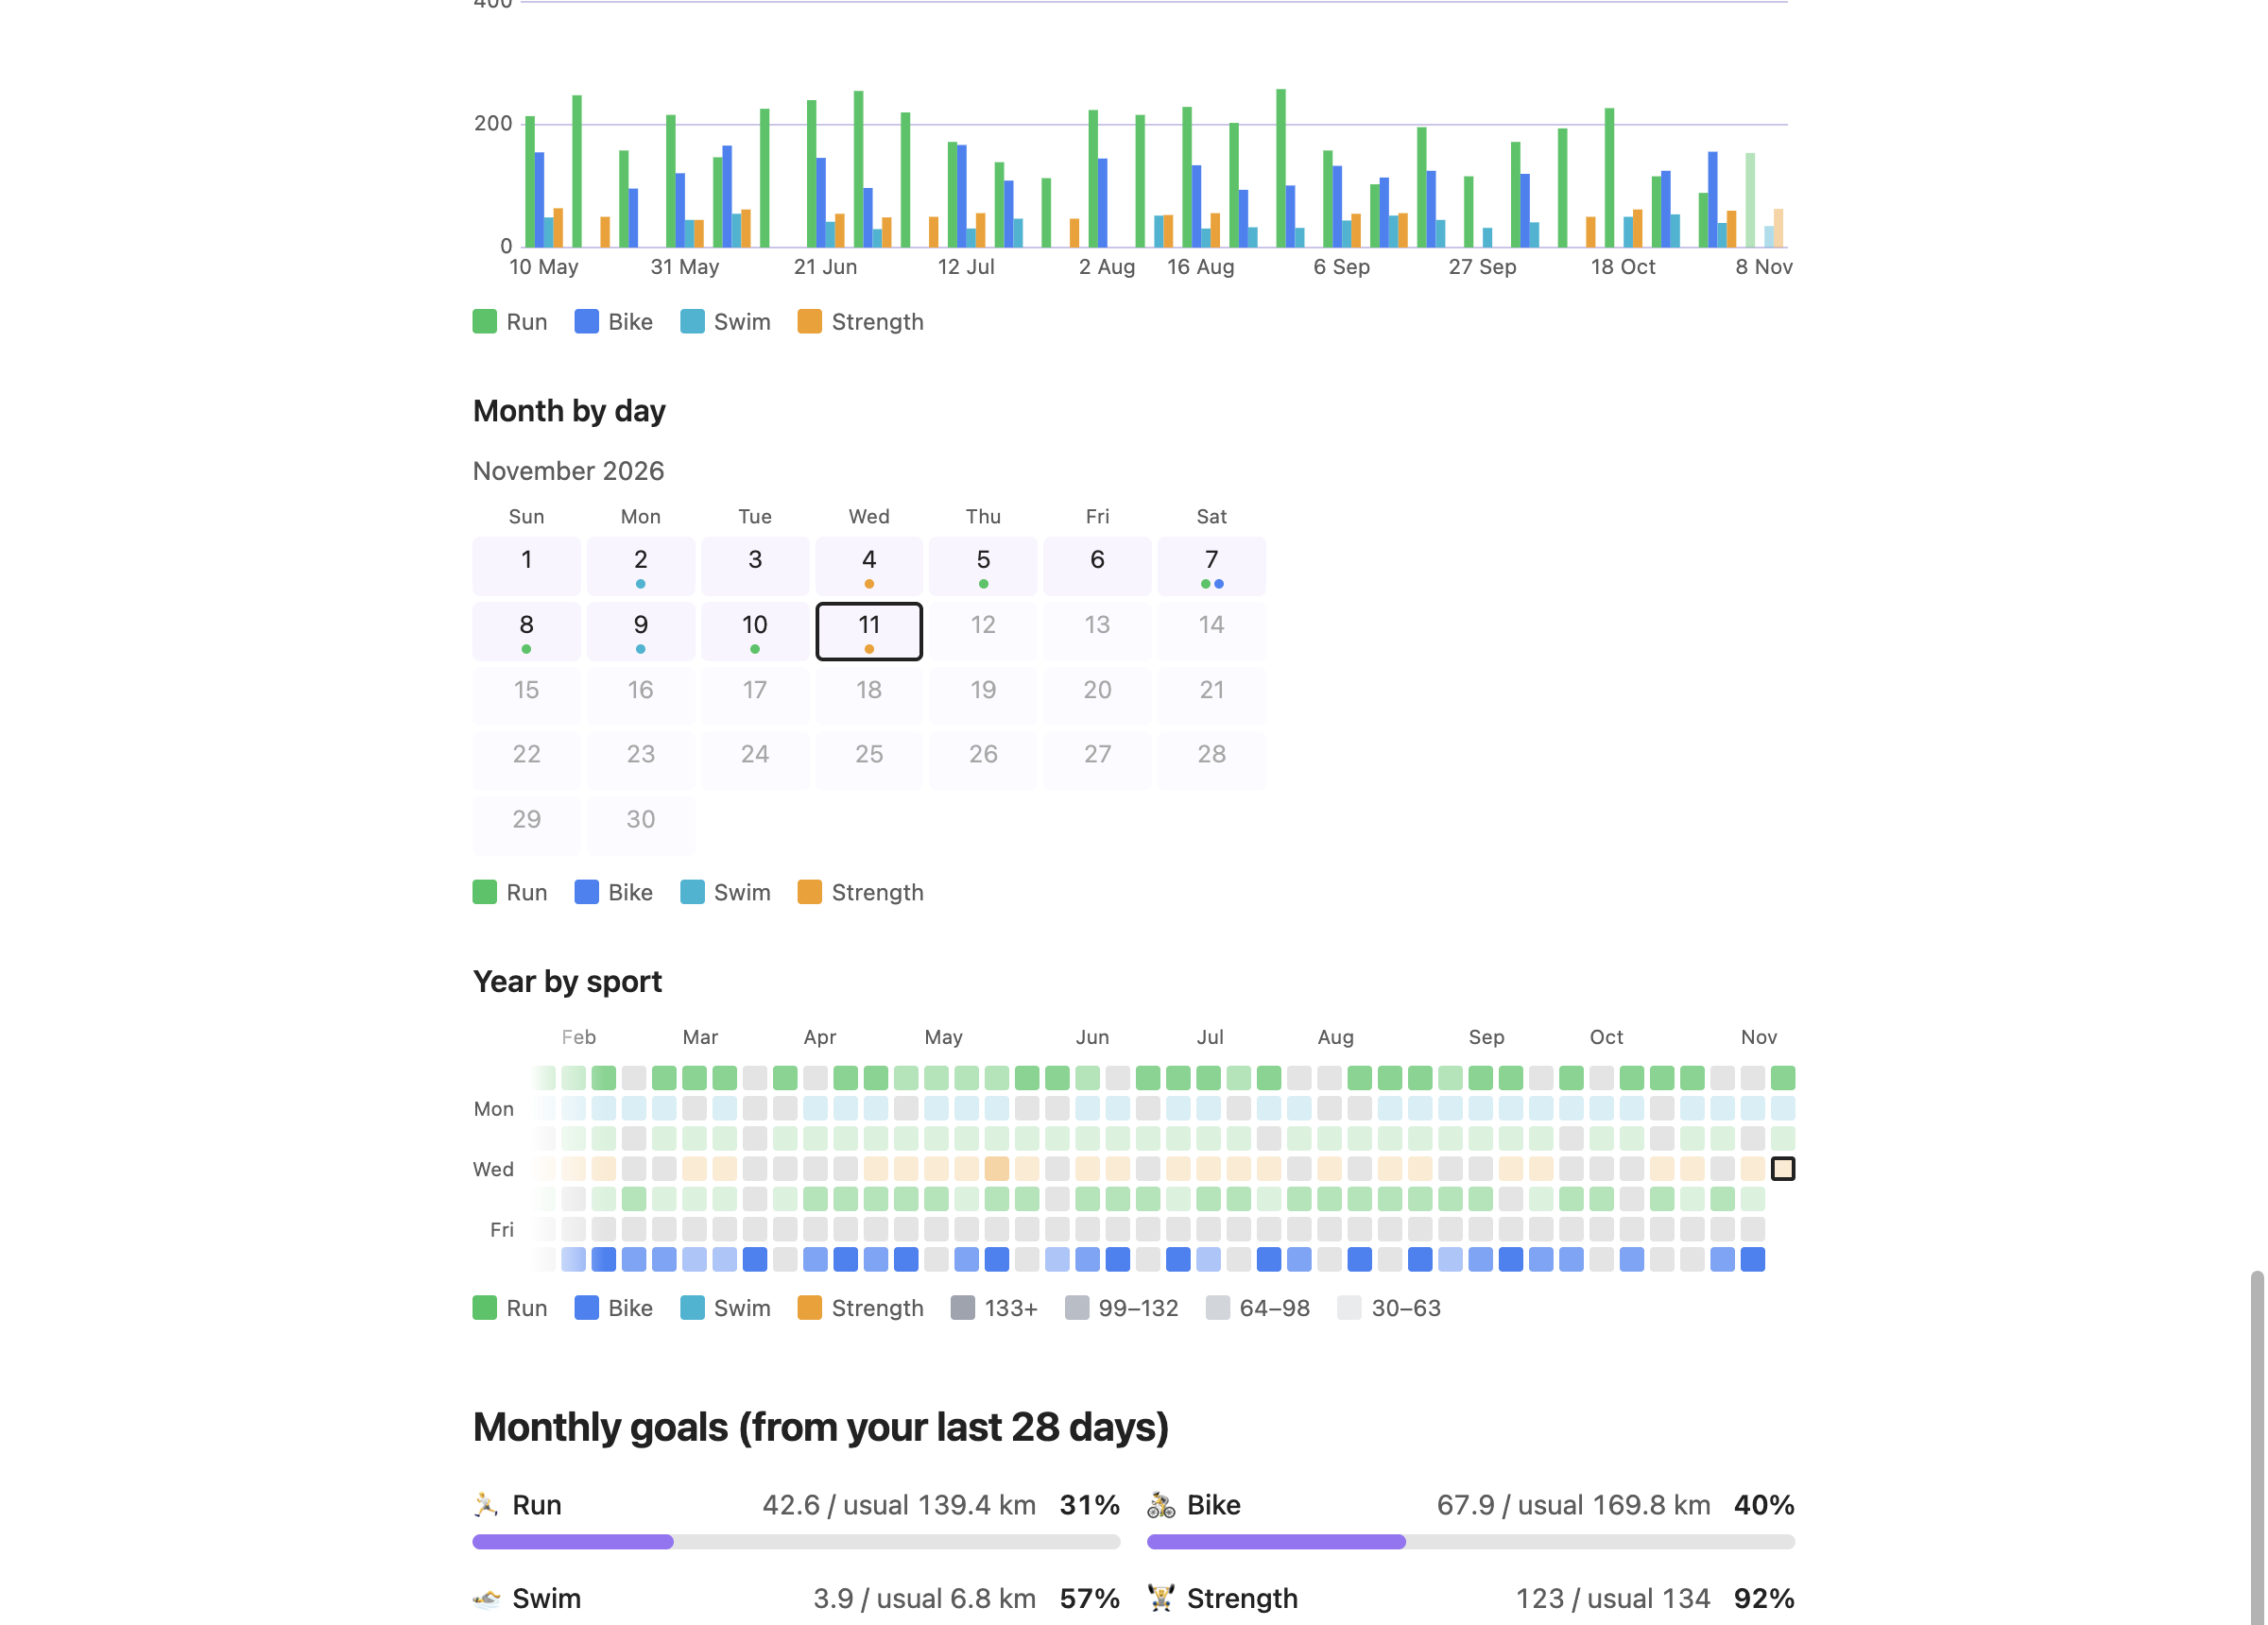
Run, bike, swim and strength per week, a month calendar, a year map by sport and monthly goals.
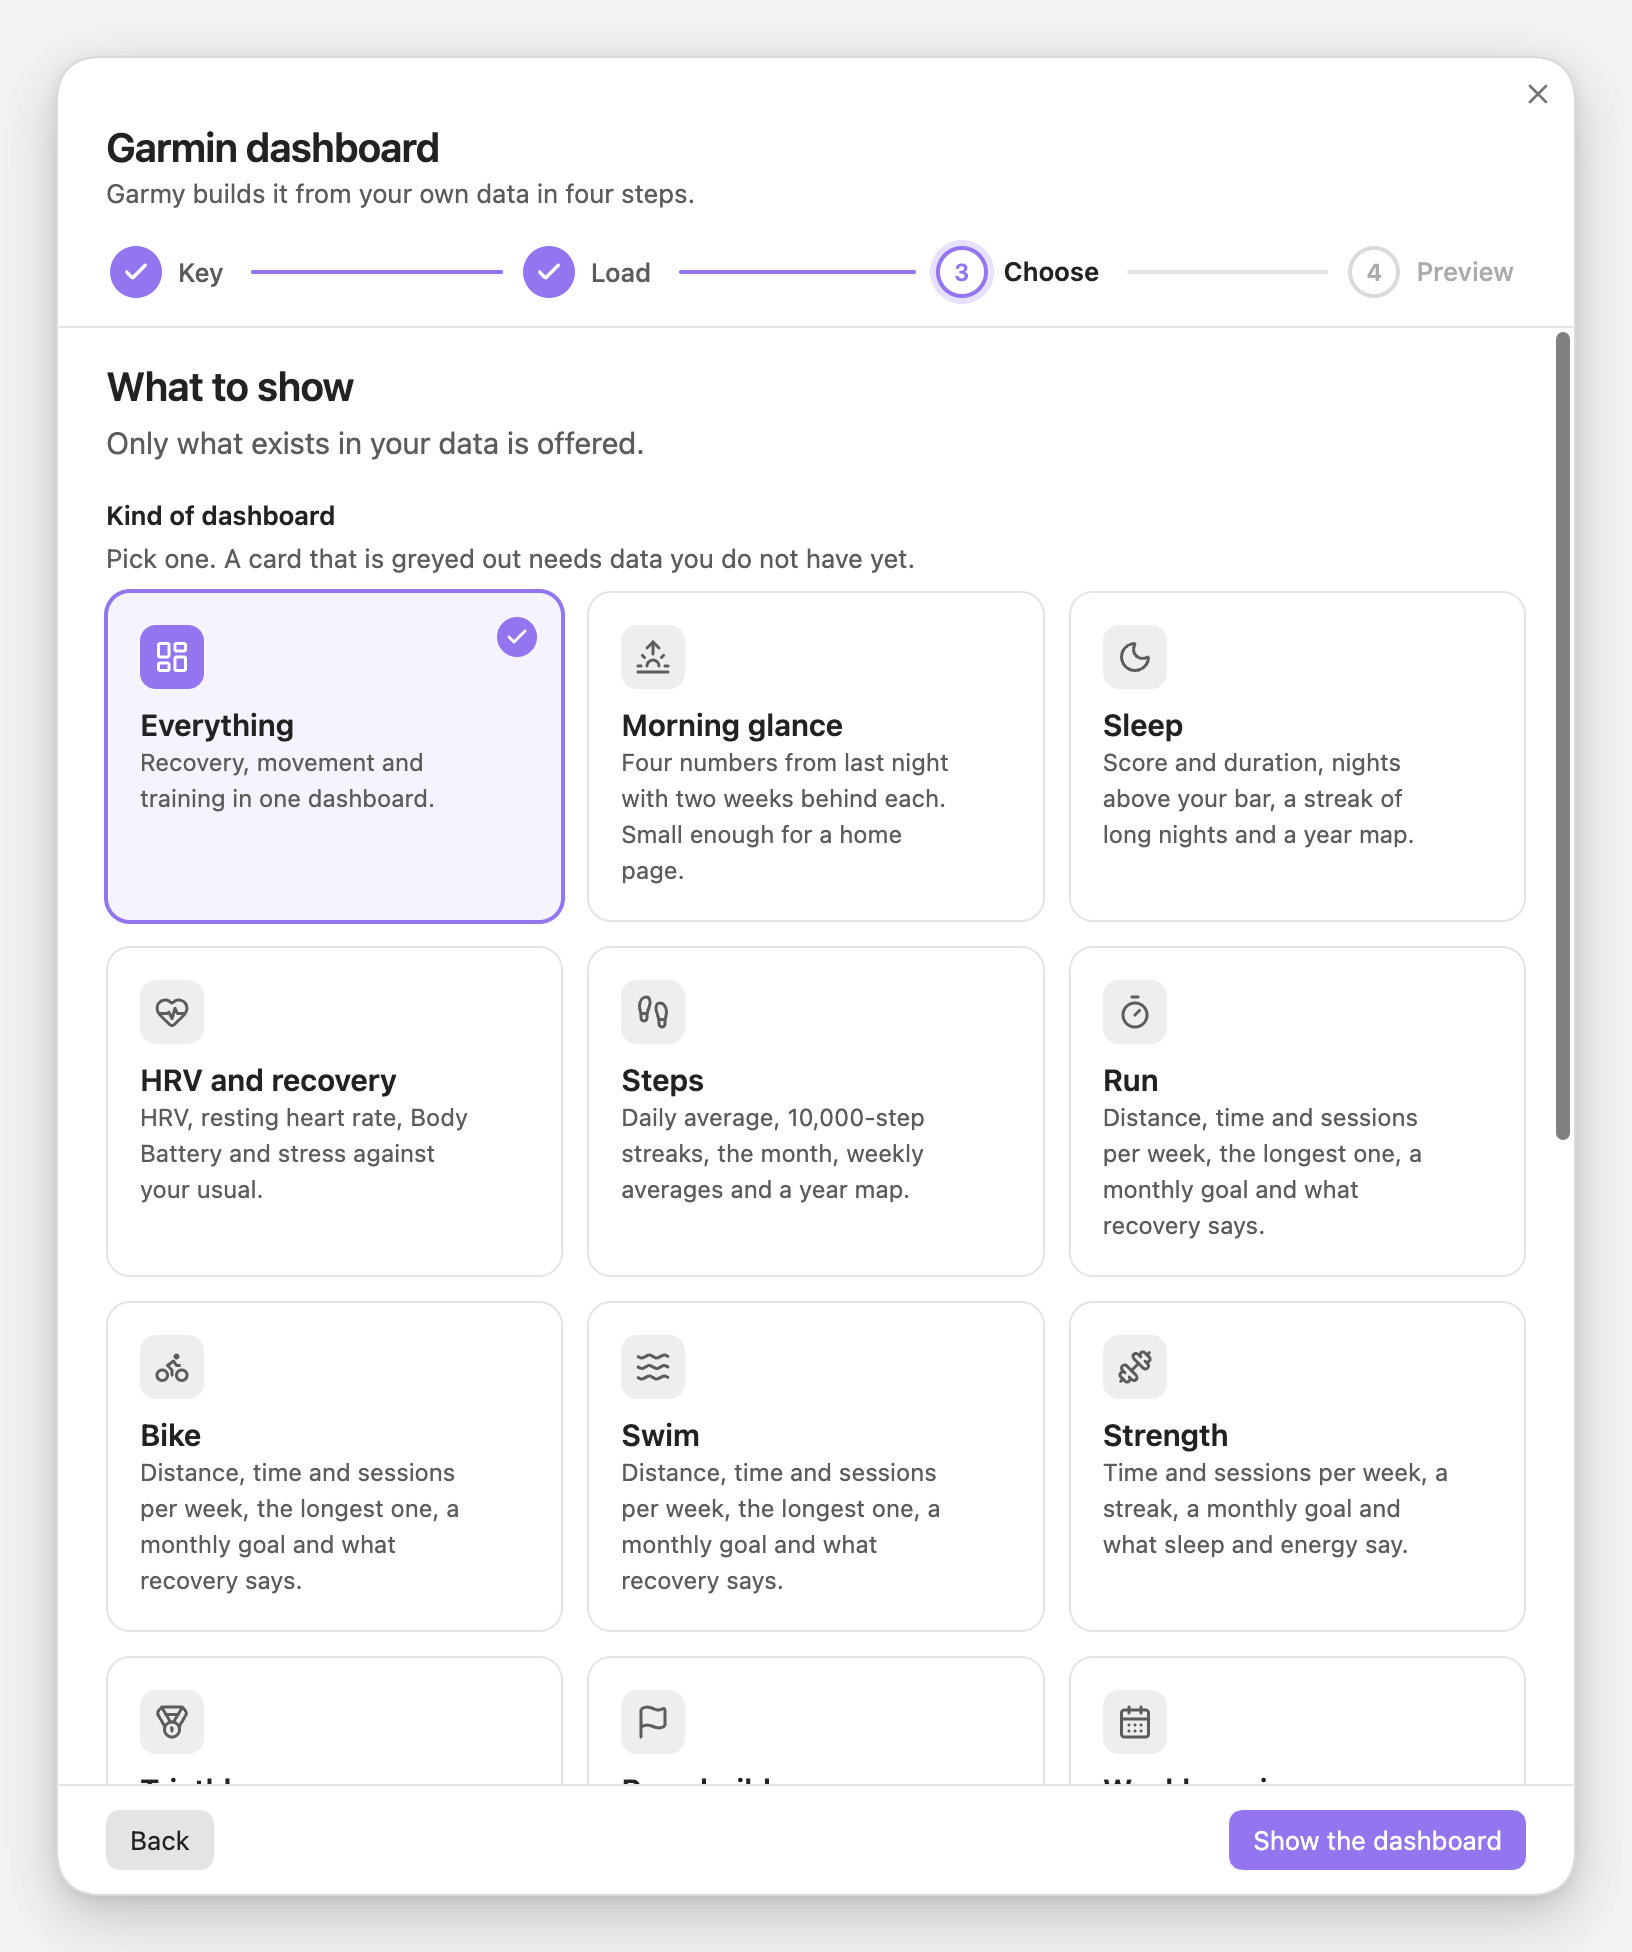
Sleep, HRV, steps, one page per sport, triathlon, race build, weekly and monthly reviews: what each shows and what it needs.
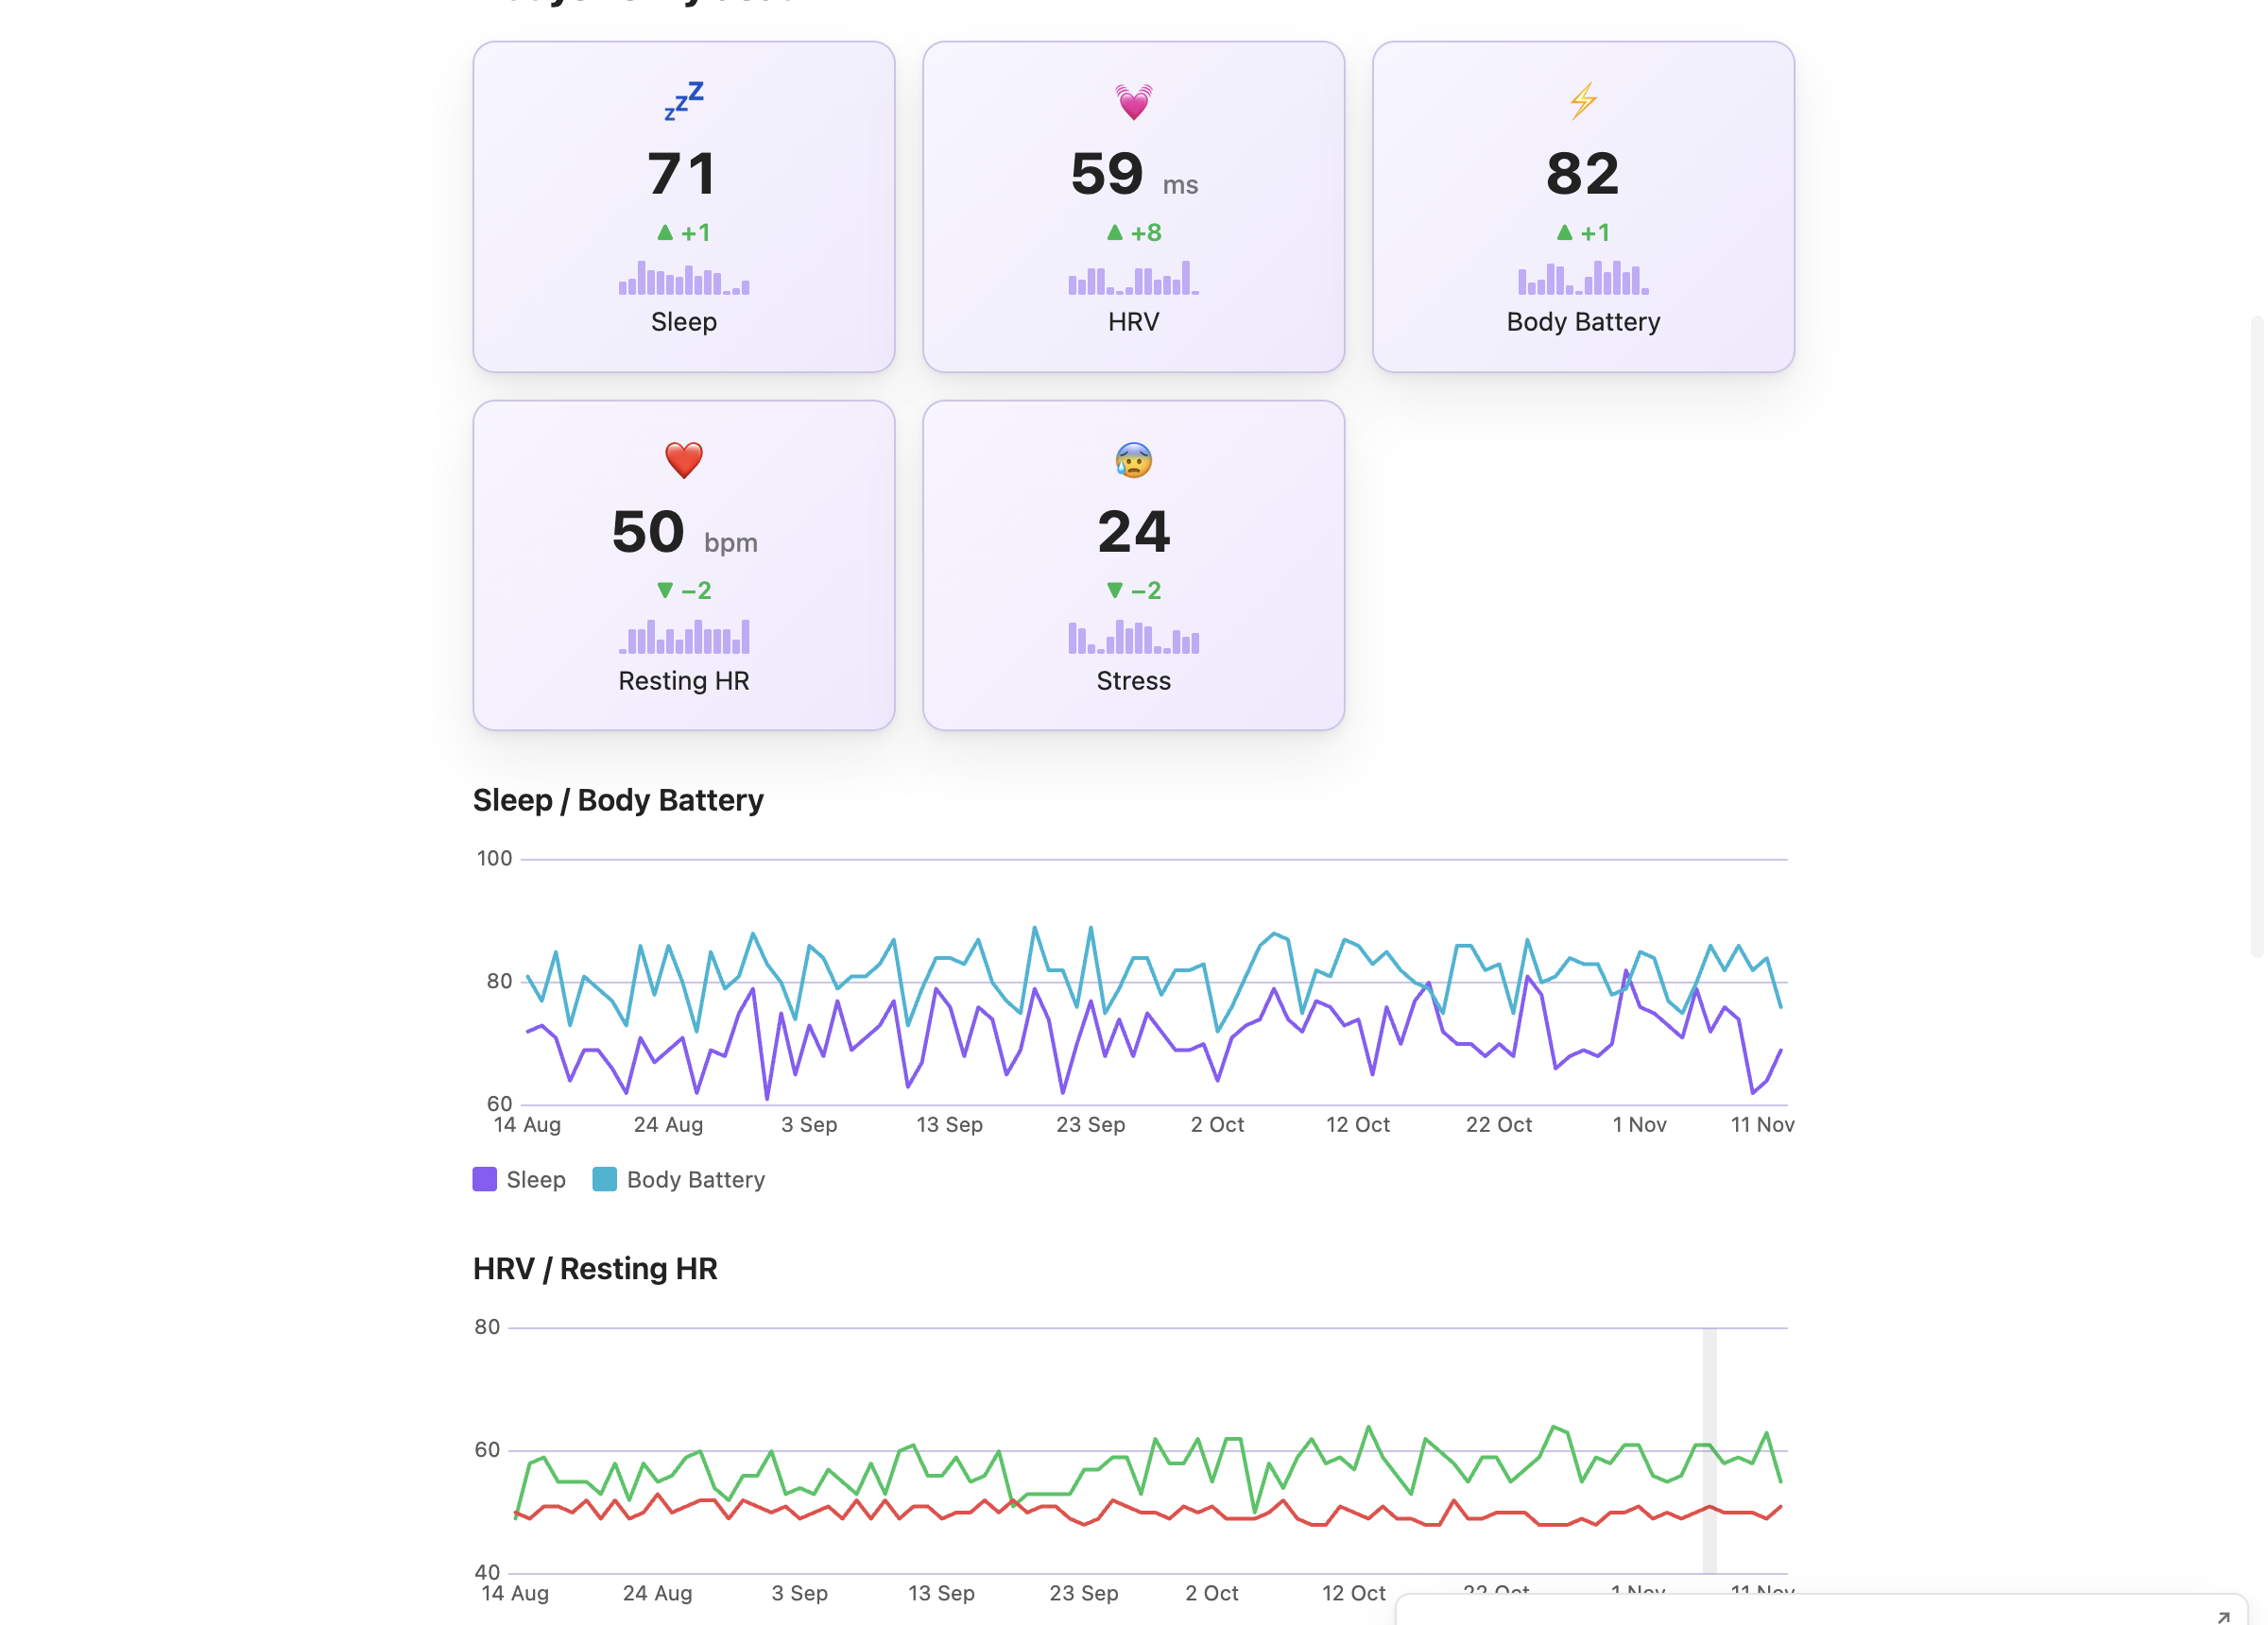
Sleep score, sleep duration, HRV, resting heart rate and Body Battery as cards and charts in one note.
Install Garmy and Dashy, load your history and pick Race build in the third step.